

Volume 24, Number 1; July 2006
Editor: John R. Percy
Contributions to this Newsletter are gratefully received at any time. [They might help the editor to overcome his chronic tardiness in putting this Newsletter together.] Please send them to: John Percy, Erindale Campus, University of Toronto, Mississauga ON, Canada L5L 1C6; e-mail: jpercy@utm.utoronto.ca All material in this Newsletter has been written by the Editor unless otherwise indicated.
Contents:
- A Tribute to Ray Thompson Upon His "Retirement"
- Status — The AAVSO Photoelectric Photometry Program
- PEP Highlights from the 2005 Fall Meeting
- PEP Highlights from the 2006 AAVSO Spring Meeting
- Two New Books on Variable Stars
- Campaigns (Continued)
- Pulsating Red Giants (Continued)
- Simple Analysis and Science with PEP and Visual Data, or What My Students Did Last Year
- The AAVSO Education and Outreach Committee
- The Latest from MOST — Canada's Humble Space Telescope!
- Another Proud Canadian Achievement
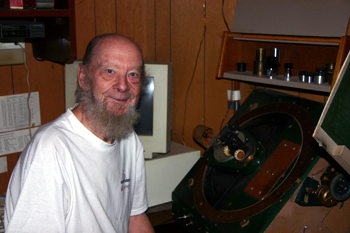 |
| Figure 1: Ray Thompson, with his polar axis refractor, which he used for many of his variable star measurements. Photo taken in September 2005 by Dietmar Kupke. |
One of Canada's most remarkable amateur astronomers, and one of the AAVSO's foremost visual and PEP observers, has "retired" from his home and observatory near Toronto, and moved to Halifax to be closer to his daughter. Ray's contributions to astronomy extend over more than half a century. As of 1988, he had logged over 7,000 visual observations. In recent years, he was the AAVSO's most prolific PEP observer. That's remarkable, considering his climatically-underprivileged location, just outside Toronto. But he dealt with that through ingenuity; in the winter, he observed in the comfort of his home, through a polar-axis refractor that brought the photons into the house!
In 1967, he received the Chant Medal of the Royal Astronomical Society of Canada (RASC), which is awarded "on the basis of the value of the work carried out in astronomy and closely allied fields of original investigation". The citation read that "He has achieved distinction both in the field of instrumentation and in observational astronomy. He built his own observatory in 1960 which now (1967) houses a 6-inch refractor, a guide telescope, a finder with illuminated cross-hairs, an astrograph assembled from war-surplus aerial camera components, and a transit telescope mounted on the pier. He is currently experimenting with a low cost photoelectric densitometer, utilizing a light sensitive resistor, for the measurement of variable star magnitudes on plates which he exposed and developed. His observational work includes the following: a long-range photographic record of the sun, begun in 1957; detailed studies of a number of lunar and planetary features; comets, recorded both visually and photographically; and variable stars. Since 1960, Mr. Thompson has averaged 350 hours of observation time each year, and has actively encouraged young people in the study of astronomy. He has served the RASC Toronto Centre as Council member, Director of Observations, and as President, and has contributed articles to the publication 'Scope and to the Journal of the RASC." So, even 40 years ago, Ray could have looked back on a long list of accomplishments. But he didn't look back.
I lost track of what Ray was up to between the 1960's and the 1980's but, during that time, he was apparently very active in the AAVSO visual observing program, and in the eclipsing binary program, and in solar observing. He also built his own photoelectric photometer, following a design by Doug Welch. It worked! But the AAVSO didn't really have a PEP program at the time, although there were a few observers already using the technique. But shortly after the AAVSO PEP Program began, Ray quickly joined up and became the most prolific observer throughout the 1990's. He was quick to adopt computer techniques to record and store his data, and he was quick to help other observers in the Toronto area to follow suit.
Ray then developed an interest in analyzing and interpreting his observations through the "black art" of time-series analysis -- something that I have encouraged observers to do. He was a co-author on some of my papers, and he published half a dozen papers in the 1990's under his own authorship, mostly in the JAAVSO.
When not doing astronomy, he and his wife Ilse would travel the continent in their RV, mostly to visit their family, but occasionally to attend AAVSO meetings.
In addition to his RASC Chant Medal, Ray received the "Friend of NSERC" award given by Canada's Natural Sciences and Engineering Research Council (our equivalent to NSF) for voluntary contributions to Canadian scientific research.
In recognition of Ray's retirement, the RASC Toronto Centre held a variable star workshop on October 22, 2005, at its Carr Astronomical Observatory. The workshop was led by Geoff Gaherty, Andy Beaton, Denis Grey, and Ray himself.
I talked with Ray and Ilse on July 10, and they are well. Ray is itching to get back to some observing, though Halifax is even more climatically-underprivileged than Toronto. We wish Ray and Ilse many more happy years in their new home in Halifax NS.
Status — The AAVSO Photoelectric Photometry Program
Elizabeth Waagen, AAVSO Headquarters
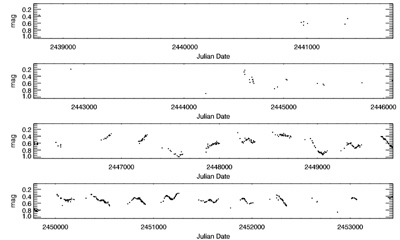 |
| Figure 2: AAVSO V light curve of 0549+07 alpha Ori, JD 2438759 - 2453434 (December 1964 - March 2005), 640 observations from 23 observers worldwide. All observations are photoelectric photometric. 542 were submitted as raw observations under the AAVSO Photoelectric Photometry program and reduced to magnitudes by Headquarters; 98 were reduced by the observer and submitted to the AAVSO as magnitudes (most of these pre-date the formation of the AAVSO PEP program). Light curve courtesy Matthew Templeton, AAVSO HQ. Click image to enlarge. |
PEP Highlights from the 2005 Fall Meeting
As usual, the fall meeting was held in Massachusetts, this year at the Sheraton Newton Hotel. There were two workshops -- one on advanced visual observing techniques, and one on using the Image Reduction and Analysis Facility, IRAF.
In the scientific paper sessions, Doug West, Doug Hodgson, and Ken Luedeke reported on "Photometry of Eta Aquilae". The special feature here was that the photometry was in the near-infrared J and H bands. This is one of the first results from the AAVSO's near-IR PEP program.
Arne Henden reported on "A New Look at Johnson/Cousins Photometric Filters", reminding us that, if we really want to do precision photometry (as we should), then we need to be aware of issues such as matching a standard photometric system such as the Johnson/Cousins UBVRcIc system.
Jerry Horne reported on "V478 Lyrae Revisited: A Current Look at Eclipses and Starspots". Eclipsing variables can be observed visually, but the effects of starspots can only be observed photoelectrically, since they tend to be 0.1 magnitude or less.
And there were many other interesting papers on visual and CCD observing, and other topics.
PEP Highlights from the 2006 AAVSO Spring Meeting
The spring meeting was held in Rockford, Illinois, and hosted by Barry and Carol Beaman and the Rockford Amateur Astronomers. There were many highlights, including a banquet at the Burpee Natural History Museum, home of "Jane" -- the juvenile T-Rex. Several of the papers in the scientific sessions were relevant to photoelectric photometry; you can find the abstracts on the AAVSO website.
AAVSO HQ organized an excellent workshop on "Writing and Publishing Scientific Papers". Those of you who are serious observers should consider if and how your results should be published; most of the workshop presentations are on the AAVSO website.
Matthew Beaky discussed "Detecting Extrasolar Planetary Transits through Photoelectric Photometry". Exoplanet transits are discussed elsewhere in this Newsletter. Matthew demonstrated that such transits could be observed with an Optec SSP-3A photometer, at a small observatory. So this is a potential observation for undergraduate students, as well as amateurs to make!
Vance Petriew and Aaron Price reviewed progress on "The Comparison Star Database and the Automated Chart Plotter". This reminds us that (i) many visual and PEP comparison stars are slightly variable; (ii) one good PEP project is to investigate the nature of the variability of these objects. One long-overdue project on my to-do list is to sort out the slightly-variable comp stars in the PEP program. But it sounds, from Elizabeth's report, as if HQ has begun to address this difficult issue.
Christopher L. Watson reported (by videoconference) on "The International Variable Star Index". The VSX will be a useful utility for every variable star observer, amateur or professional.
And there were many other interesting papers, on a variety of topics. That's one of the joys of attending AAVSO meetings. See the AAVSO website for further details.
Two New Books on Variable Stars
Books on variable stars, suitable for amateur astronomers, do not come along very often. Books for professionals usually take the form of conference proceedings, and tend to be a bit disjointed and technical. But two conference proceedings have recently appeared, which may be of interest to both amateur and professional AAVSOers.
The Light-Time Effect in Astrophysics: Causes and Cures of the (O-C) Diagram}, edited by Christiaan Sterken, deals with a tool which is well known to variable star observers, especially those who observe eclipsing and RR Lyrae variables -- the (O-C) diagram. This book, the proceedings of a meeting held in Brussels (Sterken's home town) in July 2004, shows that there is much more to the (O-C) diagram than that. Although much of the book deals with the (O-C) diagram, some papers deal with the light-time effect -- the fact that the time of arrival of light will vary if the distance of the source from the observer varies. This was the technique by which Roemer first determined that light travelled at a finite speed. This book deals with topics as diverse as historical solar eclipses, to pulsars and quasars. The book is Volume 335 in the Astronomical Society of the Pacific's Conference Series (http://www.astrosociety.org/pubs/cs/confseries.html). A full review of this book will appear shortly in the JAAVSO.
The second book is Astrophysics of Variable Stars, edited by Christiaan Sterken (again) and Conny Aerts. Conny is the current president of the International Astronomical Union's Commission on Variable Stars, and is an astronomer at the University of Leuven, Belgium. This book is the proceedings of a meeting held in Pecs, Hungary, in September 2005. [I congratulate the editors of both of these books for publishing the proceedings within a year of the meeting!] The book is divided into four sections: variable star science (including a paper by AAVSO Director Arne Henden, on Pro-Am Collaboration and the AAVSO), PhD projects, poster papers, and communication of scientific results. This last section includes interesting papers on outreach, on advice on giving a scientific talk, and on advice on writing a scientific paper. This book is Volume 349 in the ASP Conference Series; see URL above. As Book Review Editor of the JAAVSO, I plan to commission a full review of this book in the near future.
Campaigns (continued)
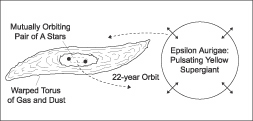 |
| Figure 3. A model for the binary system ε Aurigae, based on an article by Alan MacRobert (Sky & Telescope, 70, 527). Graphics by Jeff Dixon. |
In the last issue of this Newsletter, we described the nature and value of "campaigns" -- intensive observing projects on one or a small number of stars. A paper at the January 2005 meeting of the American Astronomical Society -- "Out-of-eclipse UBV Variations of epsilon Aurigae" by J. Hopkins and R.E. Stencil -- reminds us of one interesting star which has been studied in this way.
Epsilon Aurigae consists of a massive F0 supergiant, and (probably) a pair of moderately massive stars, in a mutual 27.1-year orbit. In 1982-84, the F0 supergiant was eclipsed by a disc around the secondary star(s). The next eclipse will begin in 2009. But the F0 supergiant is itself variable. Hopkins and Stencel have been monitoring this variability since 1984, and have analyzed the results. The variability is irregular, and has total ranges of 0.2, 0.3 and 0.4 in V, B, and U, respectively. There is some evidence for a 625-day period. The irregularity may be due to the presence of other periods; the F0 supergiant is most likely pulsating, and may do so in several modes at once. And/or it may be due to mass-transfer or orbital effects.
Epsilon Aurigae is a member of the Zeta Aurigae binaries -- binaries containing a supergiant component. Since almost all supergiants are intrinsically variable, Zeta Aurigae stars are complex and interesting. They make great targets for small-telescope PEP observers.
Pulsating Red Giants (continued)
The majority of stars in the AAVSO PEP program are bright pulsating red giants, and these continue to generate great interest among professional astronomers. About a third of pulsating red giants have long secondary periods, an order of magnitude longer than the primary (pulsation) period. Peter Wood, in the proceedings of the 2003 meeting on Variable Stars in the Local Group (ASP Conf. Series, #310, page 322) states that "the long secondary periods are the only unexplained type of large-amplitude stellar variability known at this time". One of my favourite astronomical research graphs is the following one, taken from a paper by Laszlo Kiss:
 |
Figure 4. Pulsating red giants in the Large Magellanic Cloud, plotted in an apparent K magnitude - log period graph, i.e. a period-luminosity relation. The periods go from about 10 days to 1000 days. Note the diagonal sequences, which are due to red giants pulsating in different modes. From the left, they are: third overtone (3O), second overtone (2O), first overtone (1O) and fundamental (F) mode. Note that, below magnitude 12, the sequences become denser. Above 12, the stars are "asymptotic giant branch" stars, which have become red giants for a second time as they consume helium in their cores. Below 12, the stars also include the much more numerous "giant branch" stars which are becoming red giants for the first time as they consume hydrogen in their core. The nature of the stars in the L1 and L2 sequences is not known; these are stars with the mysterious "long secondary periods". Graph from L.L. Kiss. |
Simple Analysis and Science with PEP and Visual Data, or What My Students Did Last Year
As usual, I supervised several research projects by undergraduate students, and by senior high school students in the University of Toronto Mentorship Program, which enables outstanding high school students to work on research projects at the university. Their projects illustrate a wide range of "simple science" which can be addressed using the kind of data which AAVSO visual and PEP observers generate, and which some AAVSO observers might want to try for themselves.
Most of these projects make use of the time-series analysis technique of self-correlation, which is a simple way to determine the cycle-to-cycle behaviour of the star, averaged over all the data. It can identify periods or time scales in the star, or it can determine the star's "variability profile" -- the extend to which the star varies on time scales from short to long. The software is at:
http://www.astro.utoronto.ca/~percy/index.html
Two projects involved the "by-products" of exoplanet transit surveys. Exoplanets, or extra-solar planets, are planets around other stars. They are usually discovered by their gravitational effect on their star; they cause the star's radial velocity to vary slightly, with the same period as the planet's orbit. Occasionally, they can be discovered (or confirmed) if they transit or pass across the face of the star, dimming it slightly -- typically by 0.01 magnitude or less. But exoplanets are rare. Exoplanets with orbits that are edge-on to the Earth, and so can transit, are even rarer. And the transits occur only once each orbit. So tens of thousands of stars must be measured precisely, over many weeks, if there is to be a chance to observe even one transit.
Of those tens of thousands of stars, many are photometrically variable for reasons other than an exoplanet transit. These are a gold-mine of new variable stars (as if we needed even more!). But classifying them is a challenge. All that is known is the period or periods (if any), the usually-small amplitude(s), and the shape of the light curves. The colour or spectral type of the star could possibly be determined, but that would be another step in the analysis.
Classification of Variable Stars Discovered in the EXPLORE Survey
by Rahul Chandra
The EXtrasolar PLanet Occultation REsearch (EXPLORE) project is a multi-institution collaboration; for more information, see: http://www.ciw.edu/seager/EXPLORE/explore.htm
The survey has produced a long list of new variable or suspected variable stars, but this project is an in-depth analysis of 17 of these (Nguyen et al. 2003, preprint). In several cases, the Fourier spectrum showed several peaks, only one of which was real; the others were "alias" peaks, separated from the true peak by an integral number of cycles per day. This was due to the once-a-day spacing of the observations. As an example, star 2440\_1 showed peaks at 0.65 cycle/day (1.54 days period) and 0.35 cycle/day (2.86 days period); self-correlation easily chose the shorter period.
As with the STARE survey discussed below, it is difficult to classify the variables on the basis of period and amplitude alone. [But, for a student project, this is an excellent way to get to know the different types of variables. - JRP]
Classification of Variable Stars Discovered in the STARE Survey
by Mario Napoleone
The STARE (STellar Astrophysics and Research on Exoplanets) project uses a relatively small telescope, with a 2K x 2K chip, to survey selected regions over three months. In the AUG-0 field, STARE identified and classified about 160 variables and 60 suspected variables. For more information about STARE (and for access to the data), see: http://www.hao.ucar.edu/public/research/stare/stare.html
Time series analysis, using light curves, Fourier analysis, self-correlation analysis, and phase curves was performed on 146 of these stars. Self-correlation confirmed the period/amplitude determination in 66 cases, and was inconclusive in 62. There were confusing or marginal results in about a dozen stars but, for about half a dozen others, self-correlation helped to provide improved period analysis.
Again, the matter of classification was more problematic. Most of the variables had very small amplitudes, and periods of either a few hours or a few days. The former were generally classified as δ Scuti stars, though other classifications are possible. The classification of the latter stars was even more difficult, since they could be small-amplitude pulsating stars, rotating spotted stars, or small-amplitude eclipsing or ellipsoidal variables. STARE tended to choose the latter classification, even when there was no obvious sign of the classic characteristic of an ellipsoidal or eclipsing variable -- two unequal minima in the light curve. Conclusion: it is difficult and unwise to attempt chassification of small-amplitude variables -- especially those with periods of a few days -- from photometry alone. [But again, it's a great way for students to learn about the characteristics of different types of variables. -- JRP]
Two of my students did projects on T Tauri stars -- a new area of interest for me. T Tauri stars are complex variable stars with unique spectra; they are sun-like stars in the final stages of their birth. They are still accreting gas from a surrounding disc. They have strong magnetic fields which may channel material from the disc. If so, there are "hot spots" where the gas impacts the surface of the star. This can produce flares, or flickering -- the same kind of flickering that occurs in dwarf novae as material from the cool component impacts their accretion disc. And in the weak or "naked" T Tauri stars, which have lost their disc, the magnetic field may produce cool spots, like sunspots. So the stars vary in brightness, with the same period as their rotation period, as the spots are carried around the star. They are rotating variable stars.
 |
Figure 5. An artists's impression of a T Tauri star. Gas and dust from the accretion disc spirals slowly onto the star, guided by the magnetic field as the gas nears the star. The rotation period of the star may be as short as a day or less, so the hot or cool spots on the star may produce rotational variability. Some of the accreting material may be ejected or squeezed along the rotation axis, producing bipolar outflows. Graphics by Jeff Dixon. |
Further Analysis of CCD Photometry of T Tauri Stars
by Sergiy Grynko
This project extended a pilot project carried out by two high school students in 2003-4, to investigate the use of self-correlation in analyzing CCD photometry of T Tauri stars, from the on-line database maintained by Professor Bill Herbst, Wesleyan University. This technique was very promising, and a paper has just been submitted to PASP (Percy, Gryc, Wong, and Herbst 2006).
Sergiy investigated a much larger sample of stars, with the following results:
- Self-correlation can help to identify periods, even in stars with very sparse data.
- Self-correlation can be useful in stars whose Fourier spectra show "alias" or false periods.
- The rotation periods of the periodic T Tauri stars are a few days.
- Very few Herbig Ae/Be stars -- massive analogues of the T Tauri stars -- have periodic variations. Those that do are likely eclipsing variables, not rotating variables. But eclipsing binaries among infant stars are very interesting!
- For several T Tauri stars with cool spots, the amplitude of the periodic rotational variability varies on a time scale of years, indicating that, like the sun, these stars have spot cycles.
Analysis of AAVSO Visual Observations of T Tauri Stars
by Rohan Palaniappan
 |
| Figure 6. The self-correlation diagram for visual observations of R CrA. This is not a light curve or a phase curve; it represents the way in which the light curve correlates with itself on time differences Δ. The intercept on the vertical (Δmagnitude) axis is about 0.25; this is the average observational error of each point. This value is reasonable for visual observations. The repeating minima at multiples of 66 days indicate that the star has this period or time scale, and that the periodicity is reasonably coherent. The max-min amplitude of 0.12 is approximately equal to the average half-amplitude of the periodic variability. The fact that the minima are at a level of about 0.55, not 0.25, means that, in addition to the observational error, there are sources of random or irregular variability -- probably flickering as accreted mass strikes the star. |
AAVSO visual observers have been measuring T Tauri stars for three decades but -- unlike other AAVSO visual observations -- most of these observations have not been validated, because the scientific value of the data was not clear. In fact, 30 years ago, the AAVSO discounted visual observations of T Tauri stars so that 10 observations of T Tauri stars were equivalent to any one other visual observation. We have analyzed the measurements of about a dozen of the stars, using a combination of light-curve, Fourier, and self-correlation analysis. In some cases, we have been able to compare the result with the result of analyzing CCD measurements of the same stars (see above). We have determined rotation periods for a few of the stars, and determined "variability profiles" for all of them. So our most important conclusion is that the AAVSO visual observations of T Tauri stars are valuable! We are grateful to the observers who made these measurements, and to AAVSO HQ staff who validated them specially.
The summary of the 2006 AAVSO Spring Meeting, on the AAVSO website, includes an abstract of this paper.
Multiperiodicity of Pulsating Red Giants in the OGLE Survey
by Jennifer Golding
This is a continuation of Jennifer's project reported in the last issue of this Newsletter.
The analysis of measurements of bright pulsating red giants from the AAVSO PEP Program (Percy, Desjardins, Yu, and Landis 1996 PASP, 108, 139) and from a robotic telescope (Percy, Wilson, and Henry 2001 PASP, 113, 983) has provided a model for analyzing measurements of much fainter pulsating red giant variables. Thousands of such variables have been discovered in the Large and Small Magellanic Clouds, as a result of the Optical Gravitational Lensing Experiment (OGLE: L. Kiss and T. Bedding, 2004, MNRAS, 347, L83) .
Jennifer has continued to analyze some of those red giant variables which are pulsating in two or more modes simultaneously. This makes it possible to derive two or three observational properties -- the two or three periods -- for comparison with theoretical models. The more quantities you can know and measure for a star, the more points of comparison between obvservation and theory! In this way, it is possible to deduce what the modes are, and probably what the radii and masses of the stars are, and possibly whether they have lost mass as they have evolved through the red giant stage (see Percy et al. 2003, Publ. Astron. Soc. Pacific, 115, 479).
This project is being carried out in collaboration with Dr. Laszlo Kiss. Laszlo is known to many AAVSO-ers through his work with the Variable Star Section of the Hungarian Astronomical Association. They are major contributors to the AAVSO International Database, and Laszlo has been the driving force behind that group for many years. He is now a professional astronomer at the University of Sydney, Australia.
This is an ongoing project. Luminosities have been derived from the mean magnitudes (corrected for absorption) and the known distance of the LMC. Radii have been derived from the luminosity, and from the temperature deduced from the colour of the star. From the radii, the observed period, and the theoretical "pulsation constant" for the pulsation mode of the star (known from the period ratio), the mass can be derived. This has been done, but there are still some problems with the observed colours which need to be solved.
Multiperiodicity of Pulsating Red Giants
by Marina Mashintsova
 |
| Figure 7. The differential photoelectric light curve of the pulsating red giant BC CMi, obtained with a robotic telescope. The points are the observed magnitudes; the solid line is the best 5-period fit, determined with the Period04 package. Four of these periods are a few tens of days; most or all of them are pulsation periods. The fifth is a long secondary period of unknown origin. Click image to enlarge |
This project began as an offshoot of Jennifer's -- could the "irregularity" of the pulsating red giants in the OGLE survey be explained by the presence of several pulsation periods? Then, for various reasons, the project moved to a study of the variability of some bright pulsating red giants, using PEP data from a robotic telescope. Equivalent science could be done using AAVSO PEP.
As soon as the AAVSO PEP data are available, I plan to have a student carry out a further analysis of the pulsation, using a combination of AAVSO PEP and PEP from a robotic telescope. My experience has been that these datasets are actually complementary; robotic telescope PEP does not replace AAVSO PEP.
The AAVSO Education and Outreach Committee
The AAVSO Education and Outreach Committee was formed early in 2006. I have agreed to chair it, at least for the time being. Our new and growing (we hope) webpage is at:
http://www.aavso.org/education/
As you will see, there are several strands to our interests, and several major activities to be undertaken. But we also have an excellent committee, whose bios you can access from our webpage. You can also access our on-line discussion group. There are many ways in which PEP observation, or the analysis of PEP data, can be used in astronomy, physics, math, or computer education at the high school or college level.
So, if you have had experience linking variable stars and education and outreach, or if you have ideas or questions, please get in touch!
The Latest from MOST - Canada's Humble Space Telescope!
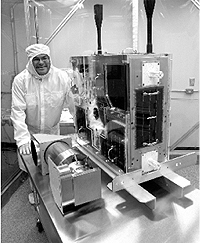 |
Figure 8. The MOST satellite in its final testing stages, at the Institute for Aerospace Studies at the University of Toronto, with its Project Scientist, Jaymie Matthews. Click image to enlarge |
Recall, from the last issue of this Newsletter, that MOST (Microvariability and Oscillations of STars) is a suitcase-sized satellite which carries out ultra-precise variable star photometry from space. The satellite continues to open up new frontiers in variable star astronomy; it is the first satellite to be devoted to variable-star research:
- Bryce Croll et al. (2006) have observed the sun-like star ε Eri over three rotations, and confirmed the presence of two spots, rotating with different periods at different latitutes -- i.e. the star undergoes differential rotation as the sun does. [ApJ preprint]
- G.A.H. Walker et al. (2006) monitored four stars with close-in exoplanets, and found strong evidence of activity or brightness increases induced on the hemisphere facing their respective planets. HD209458 shows no significant variations phased to its planetary orbit but we set a 1σ limit of 0.053 mmag (that's millimagnitudes!) to the depth of the secondary eclipse corresponding to a geometrical albedo of 0.25 which is significantly lower than for Jupiter. [Published in the proceedings of the "Tenth Anniversary of 51 Peg b" conference.]
- C. Aerts et al. (2006) discovered a new "slowly-pulsating B star" HD 163830 with the largest number of detected periods to date by a factor of 3, namely 20 periods. The amplitudes range from 0.7 to 7.6 mmag (again, millimagnitudes). 18 of the 20 periods are consistent with those predicted for an evolved 4.5 solar mass star. [Published in Astrophys. J, 642, L165-L168.]
- Chris Cameron (2006) and the MOST team reported multiple periods in the B supergiant HD 163899 -- the most comprehensive study of the photometric variability of a B supergiant. There are many B supergiants among the bright stars and, although most have been known to be variable, they have previously been classified as "irregular". The detected periods are consistent with a mixture of g-modes (restored by gravity) and p-modes (restored by pressure). [Presented at the 2006 annual meeting of the Canadian Astronomical Society.]
- G.A.H. Walker et al. (2005) have detected g-modes -- pulsation modes restored by gravity -- in the Be star HD 163868. The periods range from a few hours to a few days. The cause of the short-term variability of the Be stars has been controversial for many years but, in this star, the cause certainly appears to be pulsation. The pulsations are driven by the effect of the opacity of iron atoms, deep in the star. This is the same mechanism that explains the pulsational variability of the $\beta$ Cephei stars -- the brightest class of pulsating stars in the sky. [Published in Aastrophys. J., 635, L77.]
For more information about MOST and its work, go to:
Another Proud Canadian Achievement
Almost anything that you would want to know about variable stars can be found on the AAVSO website. But, if you are looking for another simple introduction to variable stars, and variable star observing, try the Royal Astronomical Society of Canada's variable star page at: http://www.rasc.ca/observing/variablestars/index.html