

Hi all,
I'm playing with this fast EW star.
Mag. range 12.37 - 12.76 V
Period 0.274143 d (6.5794 h)
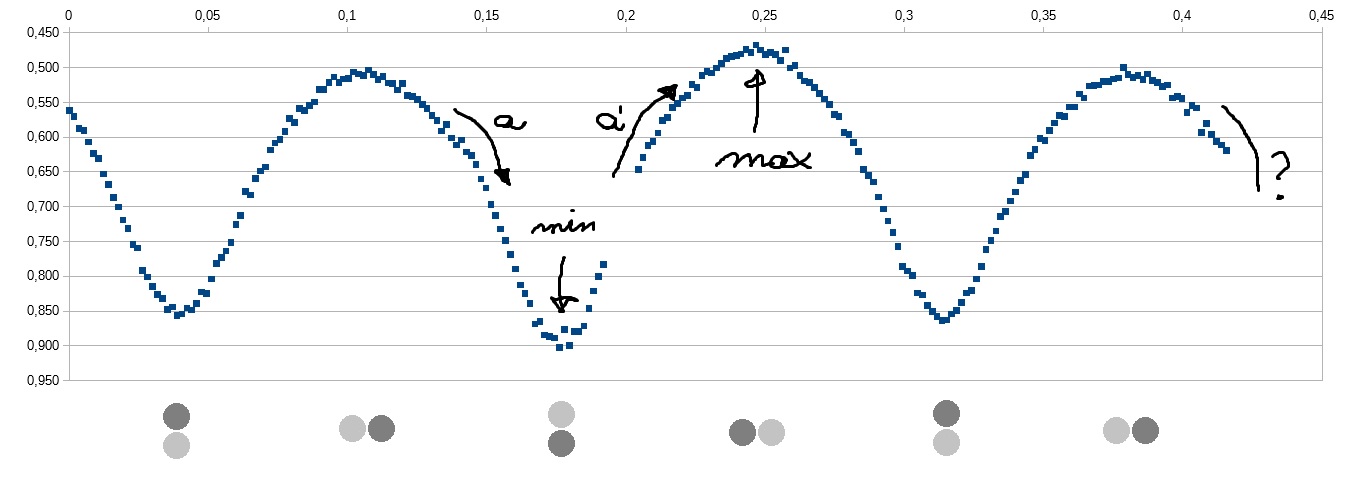
Light curve seems quite accurate but I see two different max, I'm expecting just one max value.
I mean, when star reach max value the two stars are both visible, one time A:B and the other time B:A so always the same global luminosity because both stars are visible.
In the other side, there are two clean minumum as expected, I suppose because one star is brighter then the other one.
Just to be sure, I have even plotted one comparison star respect two others showing a good precision (less the +/- 0.005mmag standard deviation)
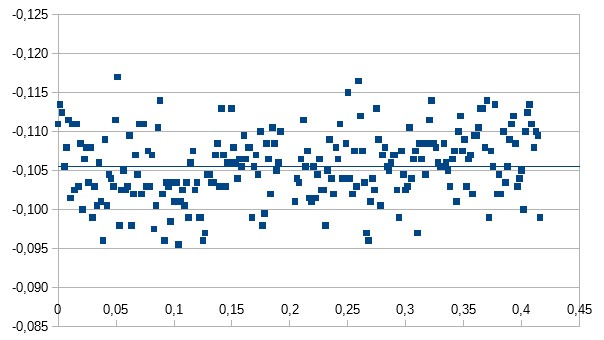
So, why this double maximum?
May be due to a flat field not so flat?
I have an other shorted session showing the same graph.
Thanks
Hello Alessio,
This is the so-called O'Connell effect, and it is not unusual, especially in short period binaries.
You can learn more about it in this paper.
Starpots and gas streams are some of the possible explanations for such difference between maxima.
Cheers,
Sebastian
Thanks, I'm going to repeat my session on this star to see what happens in the next weeks, if sunspot caused that effect I'll try to follow their signs ..