

 |
| A one-degree field of view image of P Cygni, taken from the Second Digital Sky Survey, combining the blue, red, and near-infrared plates in false color (Image courtesy SkyView and CalTech/STScI; color image processing by W. Renz) |
As summer fades in the northern hemisphere, the Milky Way passes high overhead earlier in the evening, bringing some of the richest star fields (and best picking for variable stars) into easy view. You have your choice of targets, from faint CVs to the brightest Miras and everything in between. This time of year brings a stellar powerhouse into view for Northern observers, a star that will some time in the future become one of the ultimate "variable" stars -- a supernova. The September 2009 Variable Star of the Season is P Cygni, one of the rare S Doradus or luminous blue variable stars, and the namesake for a curious phenomenon in astrophysics. Read on for more about this bright but challenging variable star.
P Cygni: (Not quite) Nova 1600 Cyg
 |
| A chart of the Cygnus-Lyra-Vulpecula region from Flamsteed's Atlas Coelestis (from the AAVSO Archives) |
The Dutch cartographer and astronomer Willem Janszoon Blaeu was the first to record the existence of a new star in Cygnus on August 18, 1600. While not as bright as the new star of 1572 found by Tycho Brahe a quarter century earlier, this visitor in Cygnus was certainly noticeable among the background stars of the Milky Way, shining at third magnitude. Also unlike previously observed novae, this object remained bright for several years before fading to just below naked eye visibility, and then returned to visibility decades later (in 1626 and again in 1655). Starting in the 1670's it returned again, and has remained on the edge of naked-eye visibility ever since. This object, since named P Cygni has become one of the most important objects in the astrophysical menagerie of variable stars.
Massive stars: supernovae to be
The fates of stars are fixed at their births for the most part, with their futures fully defined by essentially one single parameter -- their mass. The more massive a star is the brighter it will shine, the faster it will evolve, and the sooner it will die. This is mainly due to how quickly a star can burn through its reserve of nuclear fuel. The nuclear reactions that power the Sun and stars depend very strongly on temperature and density. They smash together less massive atoms like hydrogen and helium to form more massive elements like carbon, oxygen, and silicon, a process that releases heat that makes the star shine. The faster the particles move (a function of their temperature) and the more densely packed they are the easier it is to fuse them. More massive stars have higher core temperatures and pressures than less massive stars, so the thermonuclear reactions can proceed very quickly. Because these stars' core temperatures and pressures are higher, there are also several additional nuclear reactions that don't occur in less massive stars which will deplete the star's fuel reserves even faster.
Our own Sun, which is somewhat more massive than an average star in the Milky Way, has a life span of about ten billion years from start to finish; it's about half way through that lifetime right now. At lower masses, a tiny red dwarf star, with just a few tenths of the mass of our Sun, may feebly shine on for hundreds of billions of years, long after the bright stars of the Milky Way have come and gone. But the most massive stars, like P Cygni, last only a few million years from their formation to their catastrophic destruction as Type II supernovae.
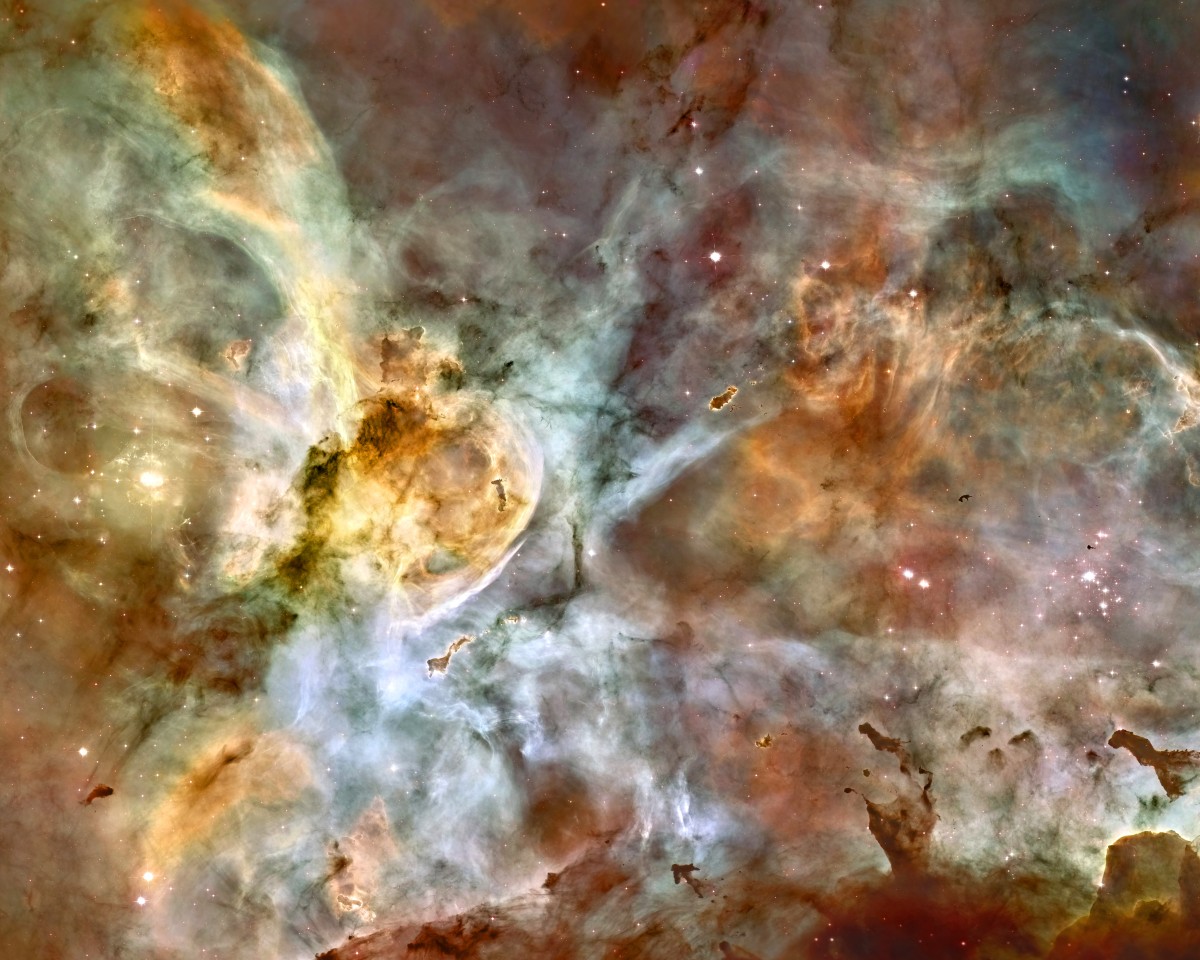 |
| A portion of the Carina Nebula; eta Carinae and the Homunculus Nebula is the bright spot near the left edge of the field. Image courtesy of Hubble Heritage (STScI) |
Since they die so spectacularly, it's probably a good thing they're so rare. Star formation in the Milky Way (and all other galaxies) appears to follow a rule that low mass stars form most preferentially, with stars of higher and higher masses less and less likely to form; the distribution of stellar masses follows an initial mass function that is strongly biased toward the lowest-mass stars, mostly likely because of the way in which star-forming clouds fragment and collapse into protostars. Supermassive stars like P Cygni are rare objects, and they feature so prominently in our skies only because of their brilliance. P Cygni and other supergiant O and B stars are some of the brightest objects in the universe, so for the brief time they exist, they certainly draw our attention.
Luminous Blue Variables: lives on the edge
P Cygni is a luminous blue variable, and the name is fully descriptive of their nature. They are intrinsically very luminous because they're so massive. They're blue also because they are massive stars near the main sequence, and so are very hot. And they're variable, too, sometimes a little, sometimes a whole lot. The luminous blue variables are stars barely holding themselves together; although their massive sizes mean strong gravity, their cores produce an enormous amount of energy, so much so that they're on the edge of blowing themselves apart.
A stable star is in a state of what's called hydrostatic equilibrium, meaning that the combined forces of gas pressure, radiation pressure, and gravity perfectly cancel one another out, and the star remains stable against contraction or expansion. But the more massive stars get, the more luminous they become. On the upper reaches of the main sequence, stars can become so luminous that radiation pressure from the heat generated in the core by nuclear reactions is almost sufficient to overcome the star's self-gravity, essentially blowing itself apart. In fact, this process probably enforces an upper limit on how massive a star can be; if a star accretes more mass than this upper limit, the core becomes so hot and luminous that the star starts to blow off its outer layers, and will continue to do so until its mass falls below that limit again. This idea was put forth by Roberta Humphreys and Kris Davidson in their 1979 paper on massive stars in the Milky Way and the Magellanic Clouds. They found that while they could find stars up to 60 solar masses on the young (blue) and evolved (red) side of the Hertzsprung-Russell diagram, above about 60 solar masses there were only blue stars. They hypothesized that above that limit, now known as the Humphreys-Davidson limit, these stars would become unstable and shed a large fraction of their mass before they could evolve to the cooler side of the H-R diagram.
That is exactly what P Cygni and the other stars of the S Doradus class seem to be doing. P Cygni underwent its greatest eruption over 400 years ago, but another example of this class, eta Carinae, underwent its own great eruption much more recently -- in the 1830s through the 1860s -- when it became the second brightest star in the sky at a magnitude of -0.8. It was also during this time that eta Car ejected the mass shell that we see today as the Homunculus Nebula. These giant mass ejections are driven by pent up radiation pressure from deep inside the star; they're a manifestation of the star desperately trying to get itself below the Humphreys-Davidson limit, and proceed in a more normal way across the H-R diagram. P Cygni, eta Carinae, and the other luminous blue variables may undergo several such events during their lifetimes. And indeed we may not have seen the last of P Cygni's outbursts. It may one day again become one of the brightest stars in the Northern Hemisphere's skies.
Low-amplitude variability: pulsation, wind variability and evolution?
Even when these stars aren't undergoing giant eruptions, they're still losing mass, and they're also still variable. In fact, there may be multiple sources of variability. In 2001, de Groot, Sterken, and van Genderen discuss the variability of P Cygni in context of other S Doradus stars, and note the existence of variability on multiple timescales: one "quasiperiodic" variation at about 17.3 to 17.6 days, another at around 100 days, still longer ones at about 1500 days, and the irregular outbursts separated by centuries or more. De Groot et al. suggest that the shortest-period variations may be pulsation, similar to the nonradial pulsations of the alpha Cyg-type variables. The fact that they're not strictly regular may be due to instabilities in the interior, or to clumpiness in the circumstellar environment. The origins of the longer timescale variations may again be due to variations in the circumstellar environment, although these variations would not be strictly periodic.
During the past year, the AAVSO has participated in a campaign to study some of the long-term changes in P Cygni. Spectroscopic and photometric work by Markova et al., and very recent work by Bernd Hanisch and Ernst Pollman utilizing photometry from the AAVSO have shown an anti-correlation between the strength of the H-α equivalent width and the optical brightness. Hanish and Pollman pointed out that if there were no relation between the sources of the optical continuum emission (the V-band flux) and the line emission, then they might be anti-correlated because the equivalent width is normalized to the continuum; if the continuum is increased, the equivalent width decreases.
The circumstellar environment of P Cyg and the other luminous blue variables is very complicated due to their extreme mass loss rates. P Cygni loses a few hundred thousandths of a solar mass per year. This sounds tiny, but over a million year lifespan, the star could shed tens of solar masses! That's an enormous amount, and the result is that the winds from these stars have a significant impact on the light that we see. In some cases, the circumstellar wind may even become opaque to the light of the star at some wavelengths, and shine on its own. P Cygni itself became famous for this, and lends its name to an important phenomenon in astrophysics.
P Cygni line profiles: a barometer for stellar winds
Gases can show emission or absorption lines depending upon their temperatures and densities. P Cygni and some other luminous blue stars were known to show emission lines at wavelengths of some atomic species like hydrogen, helium, and a few other elements because their circumstellar environments are so hot. Furthermore, these lines are quite broad, much broader than we observe in the Sun, or in a laboratory. By the late 1920's, it was understood that these lines were Doppler broadened -- the gas that was emitting them was moving toward and away from us at several hundred kilometers per second. This was surmised to be because of an outflow from the star, a strong stellar wind, and to a lesser extent because the wind is very hot. But P Cygni showed something very curious. As early as 1897, these lines were known to have a strange shape. While the longer (redder) wavelength side of the peak looked like an emission line, the shorter (bluer) wavelength side looked like an absorption line.
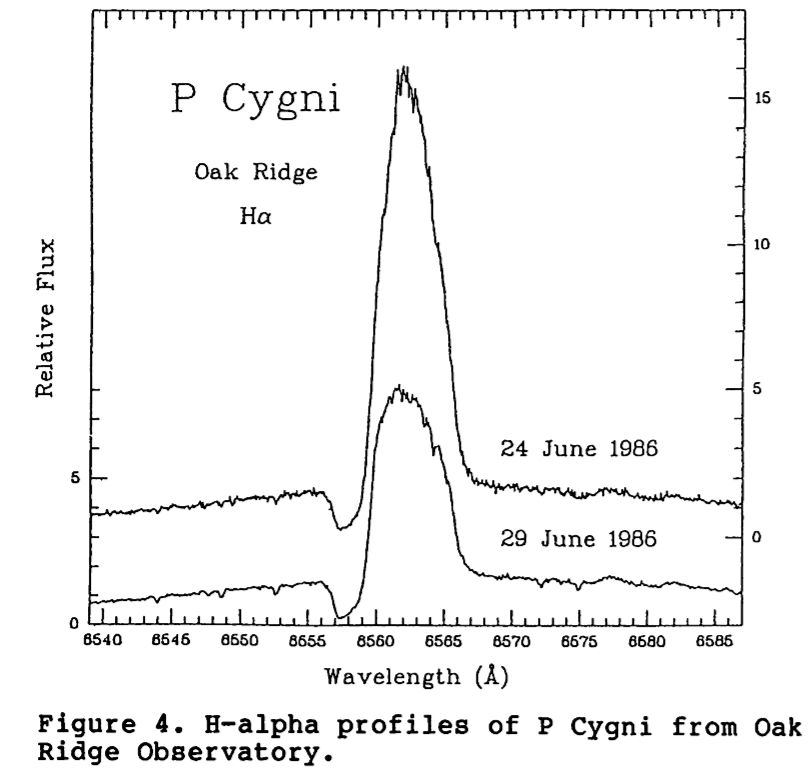 |
Spectral line profiles of the hydrogen Balmer-α line obtained at the Oak Ridge Observatory in Massachusetts. The lines show the classic "P Cygni profile" of emission on the longer-wavelength side of the line, and absorption on the shorter-wavelength side. The H-α line is centered at a wavelength of 6563 Angstroms in the rest frame. (Figure from M. de Groot, JAAVSO v.16, p.12, 1987.) |
It wasn't until about 1930 that the reason for this curious phenomenon first seen in P Cygni was understood. The cause is twofold: 1) the wind cools as it moves further from the star, and it becomes opaque at the line wavelengths of the same atomic species doing the emitting closer to the star, and 2) the Doppler effect itself. Think of the geometry of the system. You have P Cygni (or some very hot object) at the center, surrounded by a hot, ionized atmosphere that's flowing away from the star. Close to the star the atmosphere is very hot, but it cools as it moves further away from the star. Eventually, it cools to the point where the gas recombines, meaning it is no longer ionized. Near the star, the gases will be in emission because they're so hot. If we were just looking at the near atmosphere, we would see a single emission line, but Doppler broadened because the thermal velocities of the atoms in the gas are very high. As you move radially away from the star, the wind begins to cool, and beyond the point where it recombines it begins to absorb rather than emit light at the line wavelength. The only material that will absorb light relative to our line of sight is the portion of the wind directly between us and P Cygni itself. This material is moving towards us relative to P Cygni itself, which means that the central wavelengths of its absorption line will be blue-shifted relative to the rest frame of P Cygni. What happens is that the outer wind will absorb light on the blue side of the line, but let all the light on the red side of the line pass through.
We now see this in many different astronomical phenomena, and in all cases it indicates the presence of an outflow from a central source, be it a massive star like P Cygni, a Galactic nova explosion, or a wind from black hole accretion disk; they all have strong emission lines, and can have strong, fast outflows. They've been detected spectroscopically at many wavelengths including the ultraviolet and in X-rays. These features have become so important in astrophysics, that they've been given a name -- P Cygni profiles, named for the first star in which it was discovered.
The light curve of P Cygni
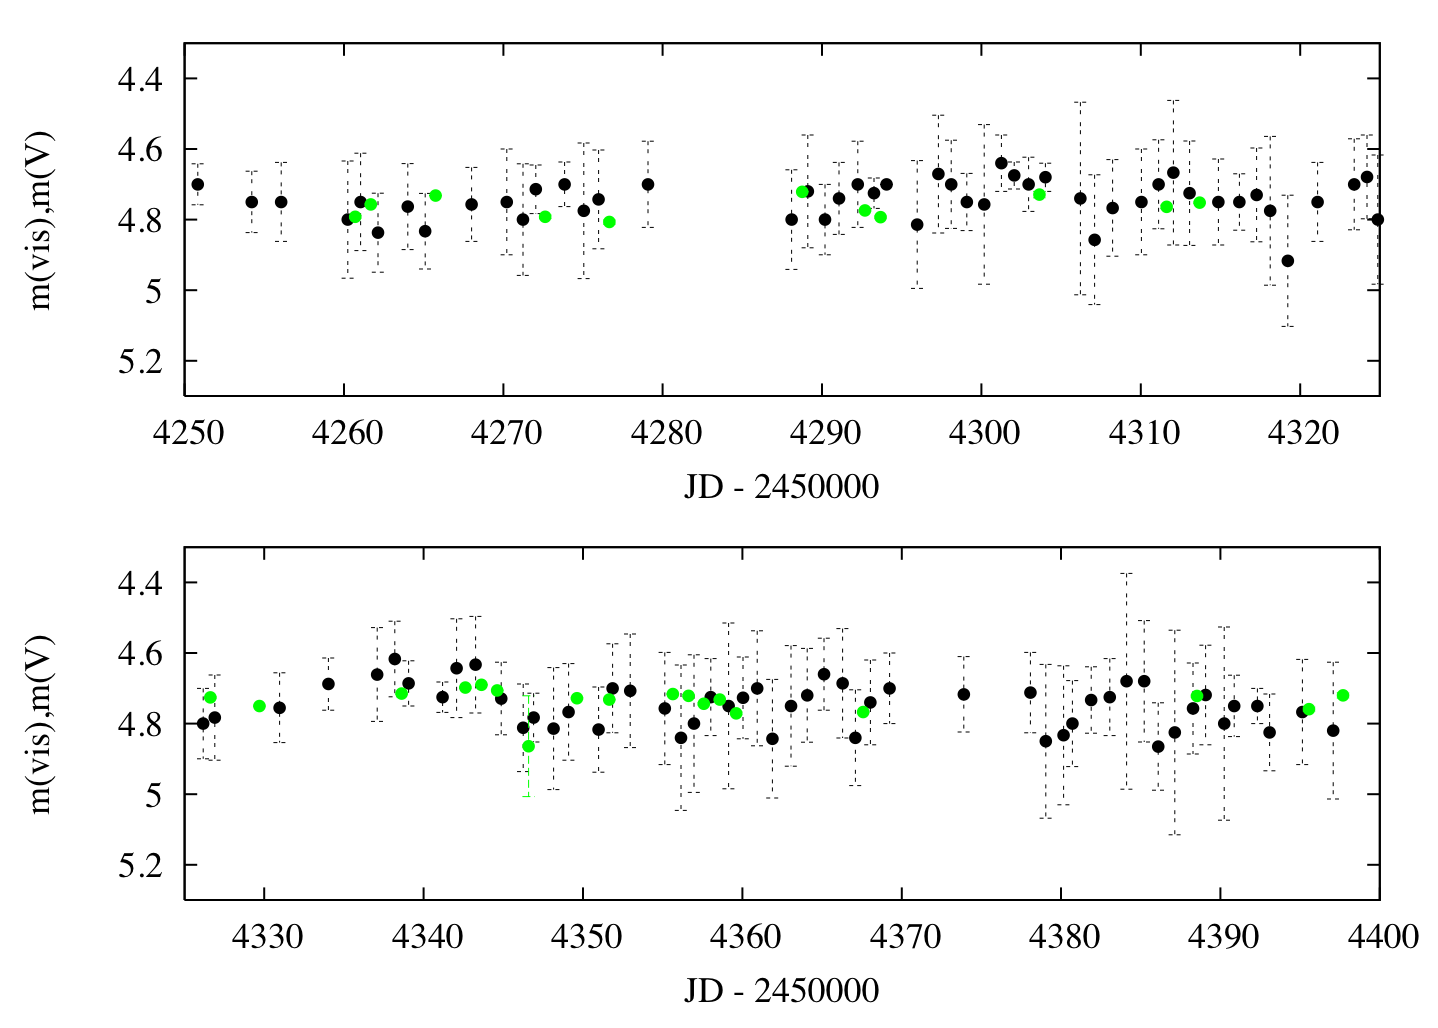 |
| A small section of the P Cygni light curve showing 1-day visual averages (black points) versus Johnson V-band measurements obtained photoelectrically. |
P Cygni is currently a low amplitude variable, and so its variations are subtle. However, they can be detected with careful observing, and lots of data. P Cygni is a challenge for visual observers, even for experienced ones. The chart history of P Cygni is fuzzy, and in the early years of observing, it's likely that multiple sequences were used. The visual light curve became somewhat tighter around 1973, which is about the time the first photoelectric observations were submitted. One way to examine the visual light curve is to average the observations of multiple observers. The light curve shows a recent sample of the data where we've made one-day averages of the visual data, and kept only the points where at least four observers observed on that same day; this provides a kind of "check" on how well people agree on what the star is doing. In this case, the visual data compare reasonably well with the Johnson V-band observations.
Even though the visual data agree fairly well with the instrumental, it's clear that P Cygni is a very low-amplitude variable at this point in its life. When you look at the photoelectric V-band observations, it's clear that the star varies at the level of a few hundredths over short timescales, rather than a few tenths. For a star as large as P Cygni is, even that is a little surprising. The physical origins of the variability observed aren't completely understood, but as mentioned previously, there is probably a combination of pulsation, internal structural changes, atmospheric changes, and perhaps even evolutionary changes.
 |
| V-band photoelectric light curve of P Cygni, 1987-2009. The variability is dominated by seemingly irregular waves and flares, with maximum variations on the order of 0.2 magnitudes. |
All of the data are capable of telling us something about this star, and so we encourage both visual and instrumental observations of P Cygni. Visual observers should try to use a consistent set of comparison stars when observing, and also use the same or similar instrumentation for all of your observations; for consistency, you probably shouldn't switch between (for example) binocular and naked eye observing, even though both are possible. Using one method may cause you to make a slightly different estimate than the other, and while both are ok, it's important to be as consistent as possible. Instrumental observers also have an important role to play. Our photoelectric photometry (PEP) program has included P Cygni for a very long time, and the archival PEP light curve for this star is excellent. If you're a CCD or DSLR observer, you can contribute too. We strongly encourage instrumental observers to fully calibrate their systems and apply appropriate extinction corrections, so that your "V" magnitudes match the Johnson V system as closely as possible. Even differences of several hundredths of a magnitude can introduce spurious signals into the data, so accuracy really does count here. And finally, for imaging detectors, remember that P Cygni is a bright star at m(V)~4.8 -- make sure you don't saturate your detector.
Last but not least, P Cygni is an excellent target for spectroscopy with small telescopes. It's a bright star with very prominent (and very strange!) spectral features. More importantly, the spectral features can also be variable, particularly in terms of line strength. The AAVSO has been collaborating with a group of European amateur spectroscopic observers; AAVSO observers have monitored P Cygni photometrically while the spectroscopists have been conducting long-term spectroscopy. Spectroscopy is an exciting new capability in amateur astronomy, and there is certainly more to come in this field.
P Cygni: a stellar powerhouse (for now!)
P Cygni and indeed all of Cygnus remain with us for just a little while longer here in the Northern Hemisphere. For those of you in the Southern Hemisphere P Cygni may be poorly placed, but you have the mighty eta Carinae in its place. Rich and distinctive star fields like those in Cygnus provide us with great opportunities, not only for conducting our own observations, but also to share some of our passion for astronomy with those around us while the weather is still fine. If the opportunity arises to take your family, friends, and community members for a stroll through Cygnus, be sure to point out P Cygni, a fascinating variable star... and a supernova in waiting!
For further reading
- The AAVSO Photoelectric Photometry Program
- Eta Carinae, the April 2000 Variable Star of the Month by Kate Davis
- M. de Groot and C. Sterken, 2001, "P Cygni 2000: 400 Years of Progress (conference summary)", Publications of the Astronomical Society of the Pacific, 113, p. 258
- M. de Groot, C. Sterken, and A.M. van Genderen, 2001, "Cyclicities in the light variations of S Doradus stars III. P Cygni", Astronomy & Astrophysics v. 376, 224
- Humphreys, R.M. and Davidson, K., 1979, "Studies of luminous stars in nearby galaxies. III - Comments on the evolution of the most massive stars in the Milky Way and the Large Magellanic Cloud", Astrophysical Journal, 232, 409
- Humphreys, R.M. and Davidson, K., 1994, "The luminous blue variables: Astrophysical geysers", Publications of the Astronomical Society of the Pacific, 106, 1025
- Humphreys, R.M., Davidson, K., and Smith, N., 1999, "Eta Carinae's Second Eruption and the Light Curves of the eta Carinae Variables", Publications of the Astronomical Society of the Pacific, 111, 1124
- G. Israelian and M. de Groot, 1999, "P Cygni: An Extraordinary Luminous Blue Variable", Space Science Reviews v. 90, p. 493
- N. Markova et al., 2001, "Simultaneous Hα and photometric observations of P Cygni", Astronomy & Astrophysics v. 366, p. 935
- J.R. Percy, A. Attard, and M. Szczesny, 1996, "Photometric variability of P Cygni: 1985-1993", Astronomy & Astrophysics Supplement Series, v. 117, 255
- J.R. Percy, et al., 2001, "Long-term VRI photometry of P Cygni", in P Cygni 2000: 400 Years of Progress, ASP Conf. Proc. 233, 31
- J.R. Percy et al., 1988, "Photoelectric and visual photometry of P Cygni", Astronomy & Astrophysics v. 191, 248
The September 2009 Variable Star of the Season was written by Dr. Matthew Templeton.