

Not Your Classical Cepheid
 |
| Click image to enlarge. Several galaxies of the Virgo Cluster. This cluster contains over 100 galaxies of many types. Credit & Copyright: Digitized Sky Survey, Palomar Observatory, STScI |
Like the numerous buds and flowers that populate the springtime landscape, so are the galaxies that make up the Virgo cluster, an enormous cluster of galaxies that inhabit an area of the constellation Virgo. Virgo also holds the variable star of this season, W Virginis. W Vir is an exciting yellow giant star that pulsates with a period of about 17 days and is the prototype of a class of stars known as the Population II Cepheids, also known as the W Vir variables. In the literature, the term "Cepheids", "Delta Cep stars", "Classical Cepheids", and "Type I Cepheids" all apply to a group of Cepheids that are physically different from W Vir. For a review of the Classical Cepheid stars, consult the previous VSOTM articles: Delta Cep, Zeta Gem, and X Cyg. W Vir is the prototype of the Type II Cepheids, a separate group of stars, which were the cause of some trouble at the turn of the century. In the process of determining the extragalactic distance scale, the Population II Cepheids were mistakenly grouped with the Population I Cepheids and an inaccurate period-luminosity function was determined that weakened the distance scale. We now know that these are two different types of stars and that the magnitude differences threw off the distance calibration significantly. W Vir is an exciting springtime observing target and as a Population II star, is one of the oldest stars in the Milky Way. These old stars are important to study because they hold clues to stellar and galactic evolution.
Eduard Schönfeld
The man who discovered W Vir was highly regarded among the astronomers of his day as a kind, thoughtful, and meticulous man that attained great scientific achievements in the field of stellar astronomy. Born in the Duchy of Meiningen, Germany on December 22, 1828, Eduard Schönfeld was taught how to read and the rudiments of mathematics by his mother. Evidently his math skills excelled because when he later attended the Gymnasium of his native town he was able to give assistance to the pupils of the highest classes in mathematics. On leaving the Gymnasium, young Schönfeld expressed his desire to study astronomy, but abandoned the idea because his father considered it a profession without prospects. On the advice of his Uncle, Eduard studied architecture until around 1849 when his former love for astronomy was revived at the University of Marburg by the lectures he heard given by Christian Gerling.
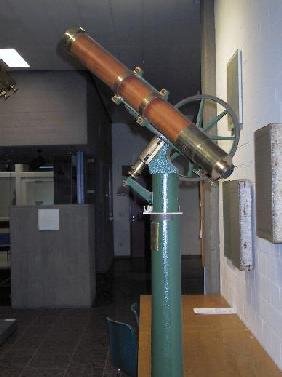 |
| Click image to enlarge. The telescope used by Argelander and Schönfeld to complete the Bonn Survey is currently located in the entrance hall of the Astronomical Institutes of Bonn University. |
In 1851, Schönfeld had the opportunity to visit Bonn University, and the charm of the famous astronomer Frederick Argelander, considered by many to be the father of variable star astronomy, was so great that Schönfeld expressed his great desire to study at Bonn. Argelander received the proposition warmly and Shonfeld matriculated at the University in 1852; by 1853 he had become Argelander's esteemed assistant. One of Schönfeld's greatest endeavors was to help F.W.A. Argelander complete the famous Bonner Durchmusterung (BD), a set of 37 large charts and a three-volume catalogue giving the approximate positions of 324,198 stars, down to magnitude 9 and fainter, lying between declinations +90 degrees and -2 degrees. Schönfeld observed tirelessly and accurately throughout the nights while reducing the observations during the day. An Astronomical Journal (1891) obituary of Schönfeld describes his work, " . . . his scientific labors have been familiar to astronomers, with whom his name has been a guarantee for all that is implied by the words excellence and thoroughness. For minute exactness and exhaustive comprehensiveness of research, it would be difficult to find his superior. Punctilious accuracy and completeness are the unfailing characteristics of his works."
Once the BD was completed in 1859, Schönfeld was appointed directorship of the Observatory at Mannheim and turned his attention to variable stars, which had created some excitement among the astronomers of the day. He discovered numerous variable stars, including W Virginis in 1866, as well as contributed much to the physics behind the variations. His research on variable stars are published in two catalogues in the Jahresberichte of the Mannheim Physical Society, Nos. 32 and 39, dated respectively 1866 and 1875.
On the death of his master and life-long friend, Argelander, which occurred in 1875, Schönfeld was appointed Director of the Bonn Observatory and Professor in the University. Shortly after entering his new office, Schönfeld personally undertook the vast labor of extending the Durchmusterung southward (the SBD), through twenty additional degrees. He supervised both observations and revisions and is praised for the attempt and completion of this great project in its finest detail. Schönfeld's personal character is described in the obituary, "With extreme modesty, kindliness and considerateness for others, were combined true dignity, unimpeachable honor, and a keen sense of responsibility in all that he did or said."
The Great Debate and the Great Mistake: Curtis, Shapley, Hubble, and Baade
 |
| Heber D. Curtis argued that the universe is composed of many galaxies like our own |
In 1920, several decades after Schönfeld discovered the variable star W Vir, there was what was called "The Great Debate" between two prominent astronomers of the time, Harlow Shapley and Heber D. Curtis. The argument was about the scale of our Universe: Curtis argued that the Universe is composed of many galaxies like our own, which had been identified by astronomers of his time as ``spiral nebulae". Shapley argued that these ``spiral nebulae" were just nearby gas clouds, and that the Universe was composed of only one big Galaxy. In Shapley's model, our Sun was far from the center of this Great Universe/Galaxy. In contrast, Curtis placed our Sun near the center of our relatively small Galaxy. Although the fine points of the debate were more numerous and more complicated, each scientist disagreed with the other on these crucial points (NASA web page).
 |
| Harlow Shapley argued that the "spiral nebulae" were nereby gas clouds, and that the Universe was composed of only one big Galaxy. |
Shapley's interest at this time was with globular clusters. He studied the period-luminosity relationship for the "long-period" variables in the globular clusters and found that the slope was very similar to that for those already discovered in the Small Magellenic Cloud, accordingly he incorporated these stars in his period-luminosity relation as "Cepheids" (for a review of the Cepheid period-luminosity relationship as a distance indicator please see the VSOTM article on Delta Cep). What he did not realize, however, was that these "long-period" cepheids found in the globular clusters were actually Type II Cepheids, a totally different population of star than Leavitt's Type I Cepheids used in earlier calibrations. While their light and period-luminosity curves are similar, population II Cepheids are approximately 1.5 magnitudes fainter than their population I counterparts.
Webb (1999) wrote, "Shapley knew that his distance ladder was a rickety structure, and it was built on the quicksand of his Cepheid period-luminosity relation." However, despite the inaccuracy of the period-luminosity relationship, Shapley successfully used his scale to investigate the structure of our Galaxy, and by 1920 had come up with a model consisting of a halo of globular clusters, a central bulge and a broad disc several tens of kpc in diameter. In the process he also moved the Sun from a previously assumed position near the center, to an outlying location in the disc. Shapley's model remains, in all its essential features, the same one we use today (Allen 2001).
 |
| Edwin Hubble used the Hooker telesecope at Mt. Wilson to demonstrate the "spiral nebulae" were in fact distant galaxies. |
Edwin Hubble is justifiably famous for his discovery that the spiral nebulae are galaxies in their own right. In the mid 1920's, and using the 100 inch Hooker Telescope at Mount Wilson, then the largest telescope in the world, astronomer Edwin Hubble identified Cepheid variable stars in the Andromeda Galaxy (M31). These stars allowed Hubble to show that the distance to M31 was greater than even Shapley's proposed extent of our Milky Way galaxy. Therefore M31 was a galaxy much like our own. In the 1930s, the further discovery of interstellar absorption combined with an increased understanding of the distances and distribution of globular clusters ultimately led to the acceptance that the size of our Milky Way Galaxy had indeed been seriously underestimated and that the Sun was not close to the center. Therefore, Shapley was proved more correct about the size of our Galaxy and the Sun's location in it, but Curtis was proved correct that our Universe was composed of many more galaxies, and that ``spiral nebulae" were indeed galaxies just like our own (Allen 2001).
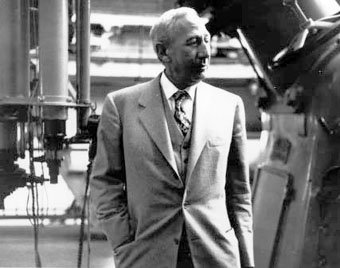 |
| Click image to enlarge. Walter Baade discovered that galaxy's were made up of two types of stars: Population I and Population II. |
It was Walter Baade who figured out that by grouping the Population I and Population II Cepheids together to determine the period-luminosity relation, the calibration would be wrong. He realized that a galaxy is made up of two types of stellar populations. During World War II Baade, working at the Mount Wilson Observatory, undertook a detailed study of M31 and its accompanying nebulae M32 and NGC 205. He was able to take advantage of almost unlimited telescope time and excellent seeing conditions due to wartime blackouts. Baade found that if he used red-sensitive photographic plates it was possible, for the first time, to resolve stars in these companion galaxies and in the central region of M31 itself. He discovered that in a galaxy, there are two types of stellar populations, "... one which is represented by the ordinary H-R diagram (type I), the other by the H-R diagram for the globular clusters (type II). Characteristic of the first type are highly luminous O- and B- type stars and open clusters; of the second globular clusters and short-period Cepheids. ... Both types coexist, although differentiated by their spatial arrangement, in the intermediate spirals like the Andromeda nebula and our own Galaxy (Baade 1944)."
Baade and Hubble had already discussed at some length an apparent discrepancy in the distance calibration; they could not understand why the globular clusters associated with Andromeda appeared to be 1.5 magnitudes fainter than those in the Galaxy. Baade's discovery of two stellar populations suggested a solution. Baade wrote:
Miss Leavitt's cepheids in the Magellanic Clouds and the classical cepheids in our galaxy are clearly members of population I, while the cluster-type variables and the long-period cepheids of the globular clusters are members of population II. Since the color-magnitude diagrams of the two populations leave no doubt that . . . we are dealing with stars in different physical states, there was no a priori reason to expect that two cepheids of the same period, the one a member of population I, the other a member of population II, should have the same luminosity (Baade 1956).
After some magnitude-comparisons with new observations, Baade eventually satisfied himself that, "Instead of one period-luminosity relation there are actually two, one for type I cepheids, the other for type II. On the average a type one Cepheid is 1.5 magnitudes brighter than a type II Cepheid of the same period (Baade 1956)."
 |
| Click image to enlarge. The top line is the period-luminosity relationship for the "Classical" cepheids and the lower line is the relationship for the less luminous W Vir stars. The open circles represent variables in galactic clusters, and the x represents variables in the Large Magellanic Cloud. The broken line shows the relationship found in the Small Magellanic Cloud based on Henrietta Leavitt's calibration (for more on this P-L relation see VSOTM on Delta Cep, while the lower line is a best fit line through the points plotted. Credit: Hoffmeister et. al. ,1985, Variable Stars, chapter 2: "Pulsating Variables", Figure 6, page 28. |
This 1.5 magnitude discrepancy would correspond to a four-fold underestimate of luminosity for classical Cepheids, and a corresponding two-fold increase in their distances. The cosmos was re-scaled when Baade presented his findings to the International Astronomical Union in 1952. The Universe, and indeed Hubble's constant for galactic recession, both doubled in size. The Andromeda globular clusters were brought into line with the Galaxy's, and the Galaxy itself lost its status as giant of the local group - M31, now at twice its previously assumed distance, was easily the largest member (Allen 2001).
Milky Way Evolution and Stellar Populations
Baade recognized that the observations of the two distinct stellar populations formed a consistent pattern. Studying the characteristics of each population brings us closer to understanding how the Milky Way was originally formed. What follows is a simplified theory of the evolution of our Galaxy. Around 10-14 billion years ago, there were no stars; the Milky Way was just a swirling cloud of hydrogen and helium. As the cloud began to collapse under its own gravity, fragmentation occurred and clusters of stars were formed (Population II). The globular clusters seen in the halo of the galaxy are the residues of these primordial star clusters. Once formed, these stars and clusters will move forever in orbits similar to the chaotic motions of the collapsing gas clouds. They are the oldest stars in our Galaxy, since they were the first to form, and they are "metal poor" because the only material present when they formed was hydrogen and helium.
 |
| Image Copyright: Nick Strobel: See Astronomy Notes for updates. |
As the Pop II stars evolved, they generated heavy elements through the process of nuclear reactions that govern a star's life. These metals were then thrown back into the interstellar material through pulsations of mira variables, stellar winds, or supernova explosions. Thus, as the primordial gas cloud of the Milky Way continued to collapse, it gained an increasing concentration of heavy elements produced by the first generation of stars. Also, as the gas collapsed it began to rotate, just as water begins to swirl as it goes down the drain. The Population I stars were formed in this rotating disk of gas, which was salted with heavy elements from the first generation of supernovae. The Population I stars are younger and more "metal rich" than the Population II stars. Because of the rotation in the cloud, the gas of the Milky Way began to flatten. It continued to flatten as it shrank, ultimately forming the thin disk that we see today (McCray, 2002).
Components of the Milky Way:
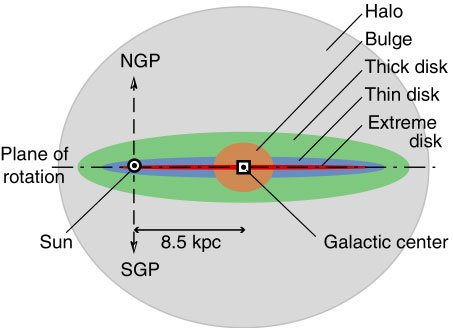 |
| Click image to enlarge. Schematic (edge-on) view of the major components of the Milky Way Galaxy's overall structure. Image credit: Roland Buser, 2000. |
The model for the formation of the Milky Way is a good one, however, the distinctions among stellar populations may not be so clear-cut and in light of new evidence, the way we think about the Milky Way has been changed. At present the galaxy is thought to contain several components. Baade's Population I stars are typified in the thin disk while the Population II stars seem to be typified by the stellar halo. However, the thick disk is now thought to correspond to an Intermediate Population II group while the metal-rich bulge, once relegated to Population II, now seems distinct from the stellar halo. Richard McCray of Colorado University describes the components:
The Thin Disk (Population I)
Has sustained ongoing star formation for 10^10 years, so it contains stars of all ages. The spiral arms of the disk contain the youngest stars, regions of molecular clouds, protostars, stars of spectral type O and B, supergiants, and Type I Cepheids. The disk population contains stars of type A and later, planetary nebulae, and white dwarfs.
The Thick Disk (Intermediate Population II)
The true nature of this stellar population is not completely clear; it was originally classified as part of the halo, but is much flatter than any other halo population. Includes some miras and some RR Lyrae variables. Most of these stars are a little richer in metals than the halo population and it is thought that the thick disk is more closely associated with the thin disc rather than the halo.
Bulge (Population II?)
Subdwarfs are seen in the central bulge of the galaxy visible through Baade's window and other regions of low absorption. These stars span a wide range of metallicity and the exact shape of the bulge is rather unclear.
Stellar Halo (Extreme Population II)
As the oldest visible component of the galaxy, the halo holds important clues to the formation of the Milky Way. The halo includes the metal-poor subdwarfs in the solar neighborhood that have large velocities with respect to the sun, globular clusters which are the true tracers of the halo and contain Population II cepheids, and RR Lyrae variables among other stars. It has also been suggested that there are two components to the halo - a young and an old.
W Vir and the Population II Cepheids
W Virginis is the prototype for the population II cepheids, which are distinguished from classical cepheids (population I cepheids) by their amplitudes, light-curves, spectral characteristics, and radial velocity curves. The Type II Cepheids are low-mass variables whose luminosities lie below those of the classical Cepheids and above those of the RR Lyrae stars. The pulsating group of Type II Cepheids called the W Vir stars have periods of roughly 10-20 days and are common in the globular clusters of the halo, however, Type II cepheids may also be found in other components of the galaxy (thick disk, bulge) as well. Type I cepheids are most closely associated with the thin disc and the spiral arm components of the Galaxy.
According to Wallerstein (2002), the Type II Cepheids may be divided into groups according to their period. The stars with a period between 1 and 5 days are called the BL Her class, periods between 10-20 days are the W Vir class, and greater than 20 days are the RV Tau class. The General Catalogue of Variable Stars classification divides the W Vir stars into type A (W Vir) and type B (BL Her) stars. They list 173 objects as CWA, CWB, or CW. The vast majority lie at low to moderate Galactic latitudes and are likely to be thick-disk stars. The following is the classification system for Cepheids from the GCVS:
CW: W Virginis variables of the galactic spherical component population that pulsate with periods of approximately 8 to 35 days and amplitudes from 0.3 to 1.2 mag in V. They obey a period-luminosity relation different from that for Delta Cep variables. For an equal period value, the W Vir variables are fainter than the Delta Cep stars by 0.7 - 2 mag. The light curves of W Vir variables for some period intervals differ from those of Delta Cep variables for corresponding periods either by amplitudes or by the presence of humps on their descending branches, sometimes turning into broad flat maxima. W Vir variables are present in globular clusters and at high galactic latitudes. They may be separated into the following subtypes:
CWA: W Vir variables with periods longer than 8 days (W Vir stars); [wallerstein 2002 puts the cut off at 5 days]
CWB: W Vir variables with periods shorter than 8 days (BL Her stars). [wallerstein 2002 puts the cut off at 5 days]
DCEP: These are the classical cepheids, or Delta Cep-type variables. Com- paratively young objects that have left the main sequence and evolved into the instability strip of the Hertzsprung-Russell (H-R) diagram, they obey the well-known Cepheid period-luminosity relation and belong to the young disk population. DCEP stars are present in open clusters. They display a certain relation between the shapes of their light curves and their periods.
Although the Type II Cepheids have never been used as primary distance indicators (except by mistake!) like their population I counterparts, they have provided many interesting clues to both stellar and Galactic evolution not envisioned a half-century ago. The W Vir stars have a period-luminosity relationship that is similar to the perioid-luminosity relationship found in Type I Cepheids. The one big difference, however, as mentioned earlier, is that the Type II Cepheids are fainter by about 1.5 magnitudes than the Delta Cep stars.
 |
| On the left is a light curve of Delta Cep, the prototype for the Classical Cepheids. To the right is the light curve for W Virginis. Notice the "hump" on the descending branch of W Vir. Credit: Hoffmeister et. al. ,1985, Variable Stars, chapter 2: "Pulsating Variables", Figure 4 and Figure 5, page 27. |
The light curves for these two types of stars may also be different as seen in the figure above. For stars of similar period, W Vir stars commonly have a "hump" on their descending branch and are usually fainter than the Delta Cep stars.
Type II Cepheid Evolution
The Population II Cepheids are dynamic stars that spend significant amounts of time in the instability strip of the H-R Diagram. As these stars ascend the asymptotic giant branch (AGB) in the last phases of their lives, they experience helium shell flashes in the area where the Carbon-Oxygen core and the helium region meet. During the shell flashes, the stellar radius diminishes temporarily, and the star moves to the left into the instability region of the H-R Diagram. In the instability strip the star will pulsate and "loop" around the instability region, moving to the left and then back to the right. Bono, Caputo, & Santolamazza (1997a) found that the Type II Cepheids are fundamental pulsators with masses between 0.52 and 0.59 solar masses. They found a correlation of mass with period in which the longer period stars have the smallest massess. So as these stars evolve, they lose mass and ascend the AGB becoming brighter and lengthening their period until they reach the tip of the AGB. The star then evolves back across the H-R diagram as an RV Tau star (for more on RV Tau stars see VSOTM R Sct). The stellar mass is then reduced to that of the central star of a planetary nebula and a low-mass white dwarf (Wallerstein 2002).
A Call for help
As the Type II Cepheids evolve to the right and to the left in the H-R diagram, it is expected that their periods should be increasing and decreasing, respectively, however observational evidence is needed to prove this theory. This is where YOU come in. By making observations of these stars, we can prove the theory correct or incorrect, but without observations there is no way to tell for sure. John Percy (2000) points out that there are very few Population II Cepheids which have been observed regularly and systematically over many decades. In particular, there are many recent gaps in the data of the prototype star W Virginis. Yet these are the stars whose periods and amplitudes may change on a time scale of decades; RU Cam is a dramatic example. In 1965-66 this population II cepheid abruptly decreased in amplitude (Percy and Hale 1998).
 |
While examining the photographic plates of the Andromeda Nebula in search of novae, Edwin Hubble marked each suspect with the letter "N". On this plate, three suspected novae are indicated. Hubble later discovered that one of the marked stars was actually a Cepheid variable. The "N" was subsequently crossed out and the star was relabeled as "VAR!" Image Credit: Mount Wilson Observatory, Historical Archive |
The period changes in these stars should be rapid considering they are in a very dynamic stage of their lives. Percy notes that there are 10 Population II Cepheids brighter than magnitude 10: T Ant, V733 Aql, RU Cam, TX Del, SW Tau, AL Vir, V553 Cen, kappa Pav, AU Peg, and RT TrA. Of these, RU Cam and AL Vir are in the AAVSO observing program and have charts available for you to make variable star estimations. There is a B-Scale chart and a reversed B-Scale chart for RU Cam while several different scale charts may be found for AL Vir by looking on the charts for Z Vir. Long-term monitoring of a carefully selected sample of Population II Cepheids would be an excellent project for AAVSO visual, photoelectric, or CCD observers. We strongly urge the AAVSO visual and photoelectric observers to begin monitoring a few Population II Cepheids in a systematic way. Help close the observing gap for these stars to provide the observational evidence needed to support the theories of stellar and Galactic evolution.
For More Information
- AAVSO B-Scale Chart
- Allen, N.J. "The Cepheid Distance Scale: A History" MSc FRAS, 2001.
- Baade, W. "The resolution of Messier 32, NGC 205, and the central region of the Andromeda nebula" Astrophysical Journal, 100, 137-146, 1944.
- Baade, W. "The period-luminosity relation of the Cepheids". Publications of the Astronomical Society of the Pacific, 68, 5-16, 1956.
- Barnes, Joshua "Populations and Components of the Milky Way" website for astronomy course at University of Hawaii.
- Bono, G., Caputo, F., Santolamazza, P. "Evolutionary scenario for metal-poor pulsating stars. I. Type II Cepheids." Astronomy and Astrophysics, 317, 171-177, 1997.
- Buser R. "The Formation and Early Evolution of the Milky Way Galaxy" Science, 287, No. 5450, 69-74, 2000.
- "Eduard Schönfeld" Obituary The Astronomical Journal, 11, 16, May, 1891.
- "Eduard Schönfeld" Monthly Notices of the Royal Astronomical Society, 52, 239, 1892.
- Gingold, R.A. "The Evolutionary Status of Type II Cepheids" Population II Variables: Frascati Workshop, 1984.
- Hoffmeister, C., Richter, G., Wenzel, W. Variable Stars, Springer-Verlag, Berlin, 1985.
- McCray, Richard "Evolution of the Milky Way" website for astronomy course at University of Colorado.
- NASA web page on "The Scale of the Universe".
- Percy, J.R. and Hoss, J.X. "Period Changes in Population II Cepheids: TX Del and W Vir" Journal of the American Association of Variable Star Observers, 29, 14, 2000.
- Percy, J.R. and Hale, J. "Period Changes, Evolution, and Multiperiodicity in the Peculiar Population II Cepheid RU Camelopardalis" Publications of the Astronomical Society of the Pacific, 110, 1428, 1998.
- Ostlie, D.A and Carroll, B.W. An Introduction to Modern Stellar Astrophysics, Weber State University, Addison-Wesley publishing, 1996.
- Vassiliadis, E., and Wood, P.R. "Evolution of low- and intermediate-mass stars to the end of the asymptotic giant branch with mass loss" Astrophysical Journal, 413, 641, 1993.
- Wallerstein, G. "The Cepheids of Population II and Related Stars" Publications of the Astronomical Society of the Pacific, 114: 689-699, 2002.
- Wallerstein, G., and Cox, A.N. "The Population II Cepheids" Publications of the Astronomical Society of the Pacific, 96, 677, 1984.
- Webb, S. Measuring the Universe: the Cosmological Distance Ladder, Springer-Praxis, 1999.
This month's Variable Star of the Season was prepared by Kate Davis, AAVSO Technical Assistant.