

Addendum
ACCURACY AND CONSISTENCY IN THE PRODUCTION OF THE AMERICAN SUNSPOT NUMBER (Ra)
Contributed by Carl E. Feehrer (FEEC)
After a few tries at counting sunspots, the new observer will become aware that his/her judgments of what is seen vary even when circumstances suggest that no changes may actually have taken place on the sun. This variation may occur as a result of changes in seeing conditions, the use of different magnifications, changes in personal judgments as to how many spots are present in groups lying close to the limb, or a host of other factors acting alone or in combination. Given that realization and the resulting expectation that the same variation probably dogs the efforts of others, the observer may wonder how the diversity of reports can be accommodated in the production of valid daily and monthly estimates. The purpose of this section is to provide a brief, qualitative glimpse of the data treatments used by AAVSO to achieve that goal.
The K-Coefficient The statistical treatment applied by AAVSO to incoming data addresses an important parameter associated with the reports of its observers: The accuracy of each observer's set of estimates with respect to a reference standard. This is addressed by computing what is called a "k-coefficient. The use of this coefficient, also called a "k-factor", in appropriate equations serves to reduce all observer reports to a common frame of reference so that a single "best estimate" can be made for each day of the month. In order to gain a general understanding of the reduction process, it is helpful to consider an example.
Assume that, over a period of time, an observer (01) has performed a total of 100 estimates. Ignoring the line for a moment, a plot of the data might look as shown in Figure 1 below. Here, each of the estimates is plotted against estimates made by the reference standard over the same period. Note that the points are dispersed and that the dispersion grows as a function of the numbers of sunspots reported. The question is: What is the position of the line that best fits what has been called the "cloud of points". The line that satisfies that condition has been drawn in the figure. The value associated with its slope provides the k-coefficient, which expresses the "correction" that would need to be applied to 01's data in order to bring them into conformity with the reference standard. Now consider a plot describing the performance of a second observer (02). Assume that those estimates and the line that best fits them are as shown in Figure 2. Note that this line has a slope that is different from that associated with 01. This means that the k-coefficient required to reduce the 02's estimates to that of the reference standard is different from that necessary to reduce 01's estimates. Further, as the relative slopes of the lines suggest, 02's k-coefficient will be smaller than 01's. 02 is more accurate, and his/her data will require a smaller correction in order to achieve conformity.
In order to maintain quality control, k-coefficients are recomputed periodically for each qualified contributor to AAVSO's database (see discussion below). These coefficients are then applied to the estimates reported at the end of a month. The mean and standard error of each day's reduced estimate, identified as Ra, and a monthly mean are reported in the Solar Bulletin. Similar statistics are reported in the Bulletin for the unreduced data, identified as "raw", for purposes of comparison.
Observer Qualifications Accurate and consistent counting of sunspots is a skill that is acquired through practice. As experience in the observing task accumulates, at least two changes in the observer's performance can usually be noted: The differences between a novice's estimates and an expert's estimates, when made under equal conditions and at the same times of day, grow progressively smaller. The deviations among the novice's day to day estimates from his/her personal average variation grows progressively smaller. Recognizing these changes, AAVSO has established two criteria that must be met before a new observer is qualified and his/her initial k-coefficient is computed: At least 80-100 observations must have been completed at times the monthly Ra means have regularly exceeded 100 All observations in the qualifying set must have been made under good or excellent seeing conditions. Until the criteria are met, an observer's estimates, though still accumulated in the database, receive statistical treatments that have the effect of reducing their impact on the mean daily values of the index.
Anyone who is interested in keeping track of their performance may compare it with the daily averages in the Bulletin by keeping careful records of their daily estimates and then completing the following four steps: With the aid of the table in the Bulletin, identify the days on which the Ra value equals or exceeds 100. Divide the value of each of these days by the value of (10g + f) you obtained on the corresponding day. Sum the resulting values and divide the sum by the number of days compared. This number is your "observatory constant" for the month in question. Keep track of this ratio over a number of months. As experience is gained and assuming that AAVSO's observing procedures and equipment recommendations are followed, they should trend toward a value of 1.0. This observatory constant, while not exactly equal to the k-coefficient computed by AAVSO, provides an approximation that is adequate for most purposes.
Figures 1 and 2
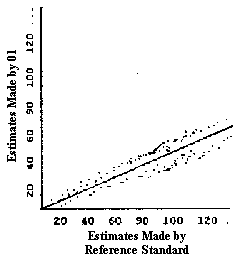 Fig. 1. Comparison of estimates made by 01 with estimates made by Reference Standard
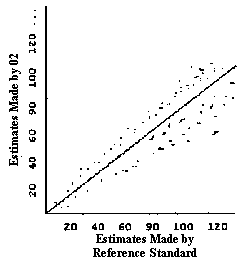
Fig. 2. Comparison of estimates made by 02 with estimates made by Reference Standard.