

Hello all,
I didn't get any answers in the general forum so I'm reposting my question here.
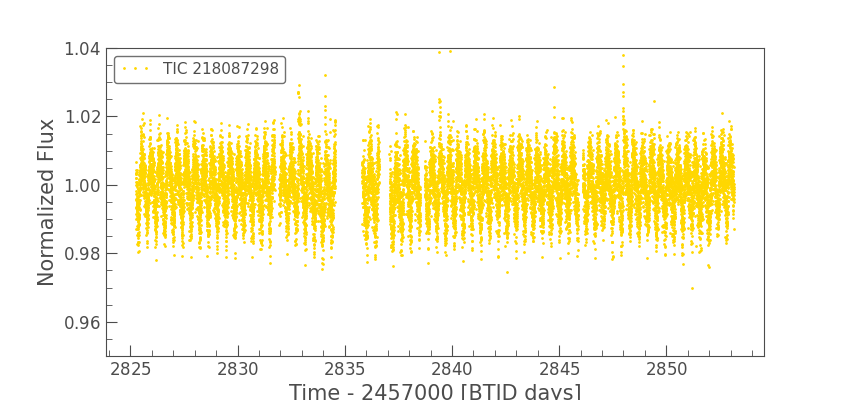
I wanted to show this light curve that I obtained analyzing with python package (lightkurve), a Tess target star (TIC 218087298) .
The three images are respectively:
the light curve of the whole series:
/sites/default/files/users/user60428/tic218087298_1.png
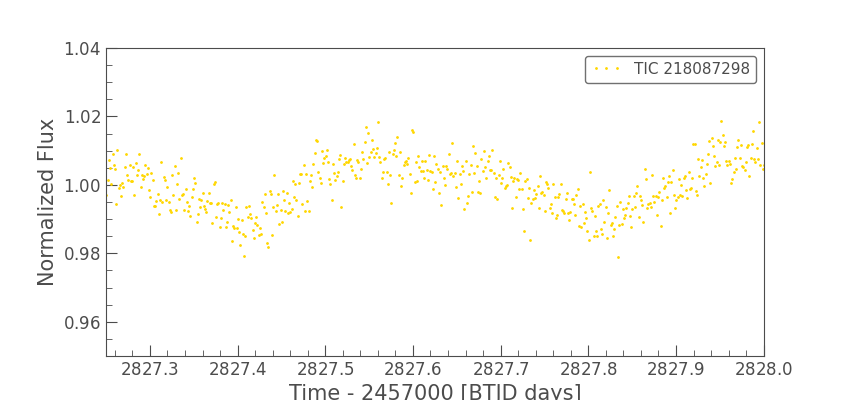
A zoom of the first light curve:
/sites/default/files/users/user60428/tic218087298_2.png
The light curve phased on the period 0.409 (days) find by periodogram function of lightkurve:
/sites/default/files/users/user60428/tic218087298_3.png
I didn't find this star in the VSX database, and on Simbad it is classified as T Tauri, while the light curve does not seem to me to be the same to those I have seen for the T Tauri.
Honestly I don't know if it is something worthy of note or to submit in VSX and I would like some help.
Thanks
Gianfranco
Hi, maybe it could be useful: here the link for the phase plot from VStar: https://imgur.com/UU3fo9N
In VizieR I just find it in ATLAS as ATO J347.5773+14.7886 , classified DUBIOUS, period 0.819140 (x 2 your proposed period)
Really small amplitude 0.02 mg , faint and cold star, probably Rotator ? I think that other long term variations can't be detected from TESS data.
But I'm not an expert, hope Sebastian or other skilled people might help us.