


Hi All,
I'm about to venture into CCD photometry so I've been keenly reading through the AAVSO Guide to CCD Photometry. The authors have done a great job of writing a very readable and very informative publication. I have one question, though.
Looking at the bottom plot in "InfoBox 3.1 – How to determine the linearity of your camera" it strikes me as remarkable that percentage differential from the trendline is less than 0.01% for all exposures between 20 and 80 seconds. The plot is reproduced below. If I understand correctly this equates to just a few ADU between measured and trendline values. For instance from the upper plot a 50 sec exposure gives 40,000 ADU, 0.01% of this is just 4 ADU. Is this true and is it typical of astro CCD's used for photometry?
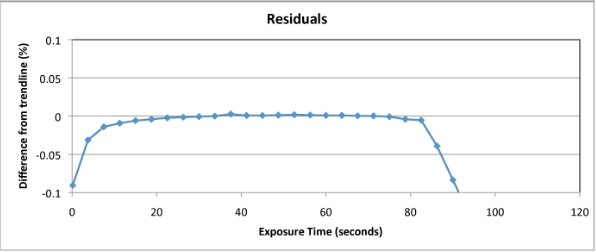
I think it more likely that the vertical scale is out by a factor of 100 and should be from -10% to +10%. This would equate to less than 1% in the 20 to 80 second range. But I'd be more than happy to be convinced otherwise. Cheers,
Mark
Mark
I believe what is being shown there is that the CCD has reached its Full Well capacity for the chip and any more photon will not be absorbed. You need to check the full well of your CCD as they are all different. This is where blooming begins and the photon "leak" to the adjacent pixels. That is why it is important to know how long a exposure will cause this to happen.
John R
Hi Mark,
You are exactly right. The vertical scale in the residuals plot is off by a factor of 100. I have just corrected it and will replace the image in the CCD Photometry Guide. Good catch!
BTW, the camera being tested has a KAF-16803 ABG sensor. Arne is the one who actually ran the test and provided the data for the plot.
Many thanks,
Sara
FYI it looks like this error has been carried over to the new 2022 CCD/CMOS manual.
Keith
Hi Keith,
Thank you for pointing out this oversight. It is now fixed in the new 2022 manual.
Best wishes,
Sara
Thank you Sara.
the plot had me worried for a moment when I compared it to my camera which I thought was pretty typical. I might suggest including a second plot in the manual which is % residuals vs. ADU. Having both helps discover non linear effects that are chip response related vs. those that are related to the mechanical mechanism at short exposure times. If you examine the attached spread sheet my camera is firly linear over a wide range of ADU. However, at short exposure times it becomes increasingly non linear. This test was done using the B filter and a neutral density filter on the electro-luminescent source. I will now do another test using the Ic filter without the neutral density filter in place which yields about 1/5 the photon rate to verify that the deviation at short exposures and relatively low flux in this test is due to a mechanical effects (most likely shutter latency) related to short exposure duration rather than non linearity of the chip at low flux levels.
Note that the test includes three internal checks. The first is that 5 second integrations are spread throughout the sequence at relatively even (and symmetrically oriented) times throughout the sequence. The second is that the exposures are symmetrically oriented in elapsed time around the longest exposures. the third is that two expousres were taken at each exposure duration in the increasing portion of the sequence and the decreasing portion. The first check (distributed 5 second exposures) tests to see if the illumination from the source is steady or has long term trend, and if a trend does exist, allows you to construct a function to correct for it. The second check is also a test for changing source intensity but after corrections resulting from the first test are applied, if applicable, it is also a test to see if there is any significant variation due to the order of EXPTIMES. I didn't expect order to be an issue but this is a way to verify that it isn't. The third check gives you multiple exposures at each exposure duration, whichallows you to check, after applying any corrections due to trending source intensity, that the scatter of the measurements at the different exposure durations (standard deviations) are consistent with a Poisson distribution, i.e. roughly vary as the inverse of the square route of the ratio of EXPTIMES or inversely with square route of the ratio of the average ADU COUNTS at the various EXPTIMES. depending on which X axis parameter you are using.
Brad Walter
Hi Brad,
thanks for the explanation of your test proceedure, very thorough. I've just put my two DSLR cameras through a roughly similar test. Both cameras have a wide linear range and the expected sharp roll off due to saturation at long exposure/hign ADU count. But results are quite different at the short exposure time/low ADU counts end.
Below are plots of the Canon 1100D test. The first plot shows ADU as a function of exposure time. The second is a little different to your % residuals plot. For each image I calculated the count rate in ADU/second then calculated the % difference from average count rate in the linear region.
Short exposure roll off is likely a shutter speed issue or possibly a low light level non-linearity. This is a bit dissapointing but my exposures are never less than 15 second so I'm confident of my photometry results.
The Canon 600D results are shown below. The short exposure time/low ADU counts end is the complete opposite of the 1100D camera response!
These non-linearities hardly show in the ADU/Exposure time plots but are blatantly obvious on the residuals plots.
My light source is an electro-luminescent panel and regulated power supply with selectable output voltages. Next I'll use a brighter setting to see if the low end roll off stays at about 10 seconds (in which case the shutter is probaby the problem) or moves to shorter exposures (in which case it is probably a low light level non-linearity issue). Cheers,
Mark
I think your % residuals and mine should end up being the same. In your case, you have divided both the regression and the ADU by the EXPTIME and, therefore, it cancels out.
You might also think about plotting your ADU per sec and % residuals vs. ADU. That way within a large range of intensities you know your linearity vs. ADU even though the EXPTIME may be very different than for your test.
I noticed that the % residuals of one camera deviated to the negative while the other to the positive for very short exposure times. I suspect shutter latency for the positive deviation but have no idea what would cause the negative. Does the 1100D have an "electronic shutter" (frame transfer) and the 600D a mechanical one, by any chance? Both curves look good. This is just a matter of curiosity.
Brad, WBY