

The Extreme Miras
Miras are typically quoted as having an average mean period range of 100 to 1,000 days with large amplitudes of light variation of more than 2.5 magnitudes visually and more than 1 magnitude in the infrared wavelengths. The period especially is a very important parameter as it is a very useful indicator of their size and luminosity as well as their age, mode of pulsation and their overall evolution. Furthermore previous research has revealed some important correlations between the period and other parameters such as amplitude, mass loss and IR excess due to dust surrounding the star.
Mattei (1997) noted that there are also correlations between the period and the shape of the light curve. Miras with periods less than 200 days generally have symmetrical light curves and smaller amplitudes. Those with periods longer than 200 days have larger amplitudes and steeper rising branches of the light curve. And those with periods longer than 300 days have quite large amplitudes and may show standstills or humps in the ascending branches of their light curves as has been shown on many Miras that have featured in the LPV of the Month series.
This month we’ll consider a selection of Miras at the ends of the ranges in periods and amplitudes, what we’ll refer to as the “Extreme Miras”.
For this exercise, extensive use has been made of VSX to search for these outliers. Whilst there are over 19,500 stars listed in the VSX as Miras, we will focus only on the subset of those stars that have observations within the AAVSO AID. Furthermore we’ll only consider those stars with a reasonable number of observations and for the purposes of this exercise, that limit will be 100. A word of warning, VSX does not list periods for all Miras, so this selection process may not be picking up all Extreme Miras.
Firstly we’ll start with the short end of the period range. 4 of the shorter period Miras have been found and then a preliminary VStar DC DFT analysis has been performed to verify the period as listed in the VSX. This information is displayed in the table below.
|
Mira |
VSX Period (days) |
VStar Analysed Period (days) |
Max Amplitude (visual mag) |
|
OV Lup |
98.6 |
98.87 |
3.5 |
|
HO Lyr |
100.1 |
100.0 |
4.8 |
|
V369 Cyg |
104 |
104.82 |
4.5 |
|
EN Vel |
107 |
108.29 |
5.0 |
OV Lup just pips HO Lyr for the shortest mean period for Mira with observations within the AID. Interestingly for all 4 short period Miras, the maximum amplitude is relatively high at up to 5 magnitudes. The first plot below shows all observations for V369 Cyg in the AID which highlights this as well as the second plot which is a 1,500 day interval centred around 1985 where the star was well observed throughout a number of cycles. One would have expected to see quite small amplitudes for these short period Miras, but that does not appear to be the case.


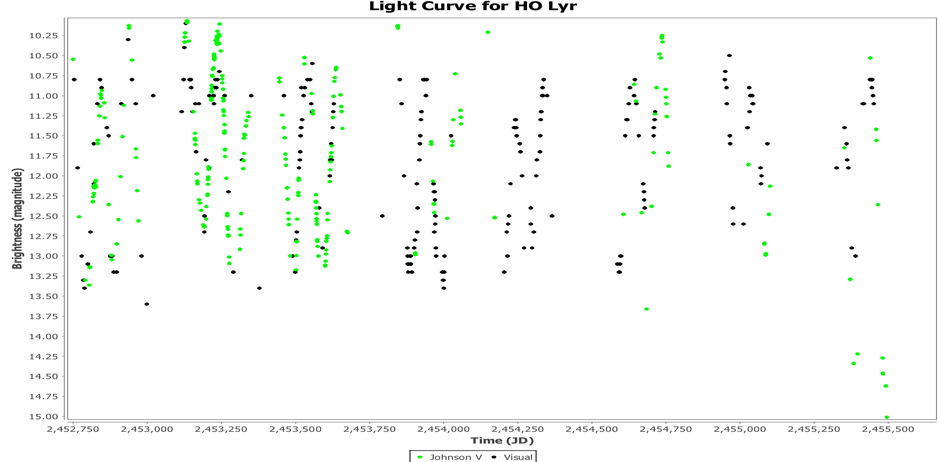
A light curve plot for HO Lyr for an 8 year period centred around 2007 is shown below. CCD observations in the latter part of this period do indeed confirm that relatively large amplitude of this LPV
Next we’ll look at the long end of the period range. Whilst the VSX lists a number of Miras with periods in excess of 700 days that do have observations within the AID, it was very difficult to verify these periods via analysis due to the paucity of data and suboptimal spacing of such data. 4 of the longer period Miras have been found and then a preliminary VStar DC DFT analysis has been performed to verify the period as listed in the VSX. The signals are a fair bit noisier than the short period Miras and therefore uncertainty in the mean period is greater. This information is displayed in the table below.
|
Mira |
VSX Period (days) |
VStar Analysed Period (days) |
Max Amplitude (visual mag) |
|
TY Cas |
645 |
650.99 |
8.0 |
|
VX Aql |
643 |
633.95 |
>4.0 |
|
RT Cep |
621.55 |
633.11 |
9.0 |
|
BN Sco |
620 |
606.15 |
>6.0 |
Hans Bengtsson from Sweden has recently identified V603 Per as another very long period Mira. Currently it does not have a period listed in VSX and thus does not appear in the Table above. However it has been followed by CCD observers since 2013 and a VStar DC DFT analysis confirms it has a mean period of 740 days with an amplitude of approximatel6 6 magnitudes (13-19V). Thanks Hans!
The overall light curve for TY Cas is shown below as well as a closeup of the light curve around 2003. The CCD V observations that commenced around 2000 have been instrumental in showing the large amplitude for this star that approaches 8 magnitudes.


As expected, these longer period Miras do show large amplitudes. However the shape of the light curve for TY Cas is reasonably regular without the presence of humps on the ascending branch. Or at least, these are not obvious. Hazen and Mattei (2002) analysed observations of TY Cas from 1888 to 2002 and concluded that the star is shown to have had a period decrease from 645 to 550 days during the early 1900’s. The period then steadily increased to 645 days until the late 1980’s were it has pretty much remained ever since. They proposed that the changes were qualitatively similar to predictions based on a helium shell flash model and that TY Cas was a good candidate for a star undergoing a helium shell flash.
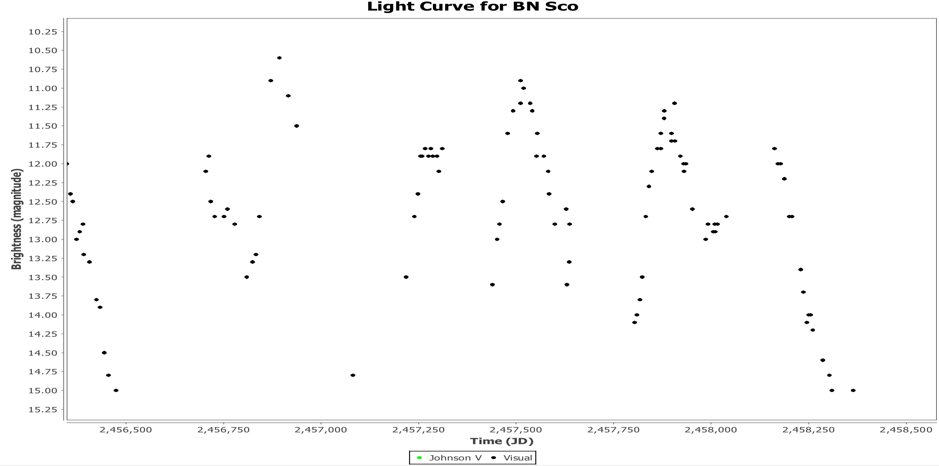
BN Sco does appear to show double maximum behaviour as can be seen from the light curve below which covers the last 2,000 days. However the paucity of data makes a definitive determination of a double maximum problematic at present. Furthermore comparison star magnitudes in the past were quite erroneous in such a crowded field and with recent corrections, we are hoping for improved accuracy going forward. Further observations are needed.
VX Aql appears to have been only sparsely observed in the period 1998 to 2009. Similarly RT Cep only started to be observed in 1996 and observations over the last few years have become sparse. The light curve in this period is shown below.

It’s much harder to determine the Miras with the largest amplitudes within the VSX database as the amplitude range is not as readily searchable. With a criterion of an amplitude of at least 9 magnitudes, the list below has been complied based on amplitudes presently listed in VSX. The VSX amplitude range was then checked against the actual light curve in VStar via a visual examination to confirm whether the VSX amplitude was representative and the results are shown in the Table below.
|
Mira |
VSX Period (days) |
VSX Amplitude Range |
Max Amplitude (confirmed from analysis of light curve) |
|
Khi Cyg |
408 |
3.3 – 14.2V |
11.0 |
|
ST Sgr |
400 |
7.2 – 17V |
9.0 |
|
R Hor |
409 |
4.7 – 14.3V |
9.5 |
|
R And |
408 |
5.8 – 15.2V |
9.7 |
It’s likely that there are other large amplitude Miras in VSX that may have been missed. Indeed if CCD observers can be encourage to follow some of the longer period Miras through their minima, it’s likely that the number of large amplitude Miras will continue to grow as many suspected ones have not been followed visually through their minima.
Alfredo Glez-Herrera wrote a very interesting article on Khi Cyg as the LPV of the Month for January 2018 and can be found here.
R And is an interesting large amplitude Mira with clearly varying and minimum magnitudes as can be seen from the plot of all observations in the AID below.
 An amplitude of 9.0 magnitudes equates to a change in brightness of flux in the visual range of a factor of nearly 4,000 times and at 10 magnitudes this factor is 10,000 times. That is extreme!
References
"Introducing Mira Variables” J.A. Mattei, JAAVSO, Volume 25, 1997
“Period Changes in the Mira Variable TY Cassiopeiae”, M.L Hazen & J.A Mattei, JAAVSO, Volume 31, 2002