

The Mark I Eyeball Team at Citizen Sky is working on a project to characterize precision and accuracy of visual observations. This is essentially a follow up to this poster (4MB PDF) presented at a meeting of the American Astronomical Society in 2006. The project is focused mainly on statistical analysis of the entire AAVSO International Database. However, there is also an experimental component which is described here. The following stars are monitored by AAVSOnet's Bright Star Monitor so we will be looking for relationships between the visual and photometric data when we control for charts and comparison stars. We are particularly interested in any covariates in the relationships (such as star color, position in sky, observer demographic information, etc.).
The goal of the project is to produce a paper that describes patterns in the precision and accuracy of visual estimates of variable stars. Anyone who contributes significantly to the project will be acknowledged in a table in the paper.
We are looking for visual observers of all type and ability. We are asking for three things:
- Fill out this 9-item survey about your observing setup and background. It will take about 10-15 minutes to complete.
- Add as many of the following stars to your observing program as you can. When possible, observe them from July 15, 2011 - February 15, 2012.
- When you submit observations of these stars, add the following data to the Comments Field:
- Temp: X LM: Y
- Where X is the temperature (please add a C or F for the units)
- Where Y is the naked-eye limiting magnitude. Use this chart of Ursa Minor to make your estimate.
For example:
Temp: 20C LM: 4.3
...would mean it was 20 degrees Celsius with a limiting magnitude of 4.3 when you made the observation.
This needs to be reported only one time per night. You do not need to do it for every observation.
This additional information will help us look for weather and time-of-day effects in the data. Please add the info when you can, but if you forget don't sweat it. The observational estimate is what is most important.
Please make use of the standard AAVSO Comment Codes to describe sky conditions such as clouds, fogs, etc.
Use New Charts
It is very important that everyone use the same comparison star sequence for these observations. So we require that everyone update their charts with VSP before they begin observing. Links to sample charts are included below.
Visual Observing Targets
Do not go out of your way to observe these stars more or less than you would for a typical star of that type. Simply add them to your regular observing program.
Name
Coordinates
Range (VSX)
Sample Charts (ID)
Notes
S UMi
15 29 34.57 +78 38 00.3
Mira w/~331d period
RR Lib
15 56 23.70 -18 18 14.9
Mira w/~279d period
X Oph
18 38 21.13 +08 50 02.8
Mira w/~338d period
W Lyr
18 14 55.88 +36 40 13.2
Mira w/~198d period
U Aql
19 29 21.36 -07 02 38.7
delta Cephei type
SU Cyg
19 44 48.73 +29 15 52.9
delta Cephei type
S Sge
19 56 01.26 +16 38 05.3
delta Cephei type
Updates
This campaign launched on July 21, 2011. Updates are sent via e-mail to official participants. We will update this web page with copies of the updates.
120209 - The data collection portion of the experiment has ended. We're now compiling the data and begining analysis. That will be coordinated via the Citizen Sky team and through their web site. As we get first results, we'll share them with the observers via e-mail. We intend to present a paper on results at the October, 2012 AAVSO meeting and submit to a journal shortly thereafter.
111031 - The visual experiment data collection continues to go well. The Bright Star Monitor is now working and taking data on all our stars. So it's as important as ever for you to continue to make and report your observations. Remember to put "Temp: X LM: Y" in at least one report per evening where...
X is the temperature (please add a C or F for the units)
Y is the naked-eye limiting magnitude. Use our online chart of Ursa Minor to make your estimate.
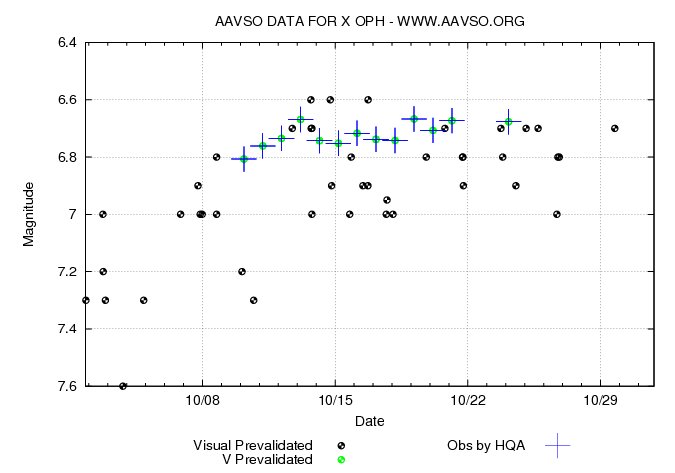
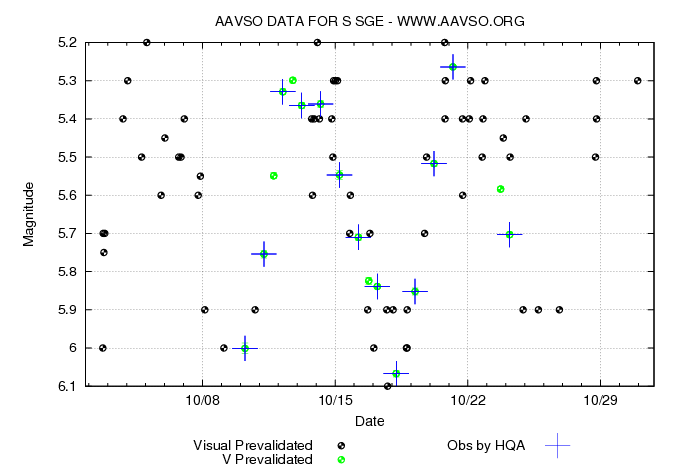
Since BSM is operating, I thought I'd share a couple of light curves with you. (link1, link2, link3) The blue crosses are data from BSM. The black dots are visual observations. The goal of the project is to look for any trends and consistencies in the differences between the blue and black data.
Notice in the X Oph light curve that the BSM data is always on the bright end of the majority of the visual scatter. Why is that? Is it due to a color difference? X Oph is a red star while the comp stars on our charts tend to be blue/white. Or is it a natural feature of the human visual processing system (Mark 1 Eyeball) to underestimate brightness? Is it related to the position in the sky? Some combination of the above?
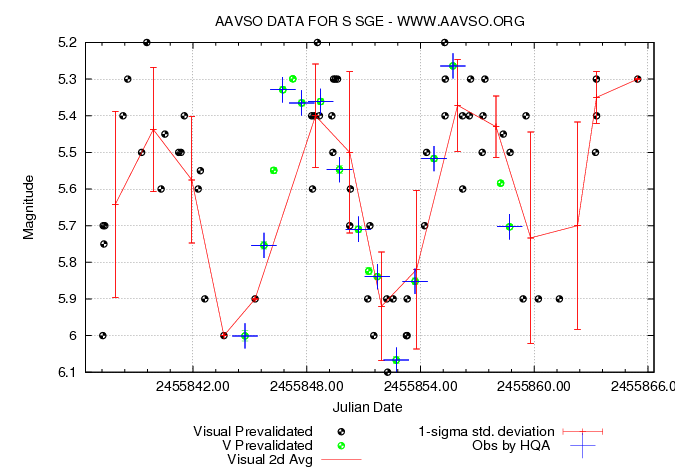
Also, look at the first S SGe light curve. It shows a lot of short term variation in the photometric data. Variation that could look random if you were looking at the visual data alone. But look at the 2nd S SGe light curve with a 2-day mean curve drawn through the visual observations. When added together, the visual data is closely aligned with the BSM data. But it has higher uncertainty and tends to be a bit more compressed (lower maxima and higher minima). Of course, these are just small samples of data. But it shows some of the differences we want to investigate when we have access to a full 6 months of data on these stars.
So please keep observing!
110926 - Please welcome two new observers to the fold: Grigoris Maravelias (MGK) and Peter Brock (BPEB). So far we have received 1,224 observations from 14 observers. And the Bright Star Monitor has begun taking calibration data now that the southwestern USA monsoon season is over. It is currently waiting on bias and dark frames to be acquired before it begins funneling us data. That should occur any day now. So please keep observing these stars. I'll send another update once the BSM is fully active. Thanks and clear skies! - Aaron
110819 - We have received 991 observations of the program stars by the following 12 observers. Of them, 111 included the temperature and limiting magnitude information. That is great! We don't need that info for each obs, but we'd like to have it at least for one observation for each night (but the more often, the merrier). So this is an excellent start. Thank you so much to the following observers:
ARLA - Robin Anderson, Sweden
BBI - Bruno Billiaert, Belgium
BEB - Ray Berg, USA
DJX - Mark De Jong, Canada (I'll be at SSSP next week, if you are there say Hi!)
EMA - Marc Eichenberger, Switzerland
MHH - Jon Moehlmann, USA
PKV - Kevin Paxson, USA
SJAT - Jan Starzomski, Poland
SRYA - Ryan Scott, Canada
SSHA - Sherrill Shaffer, USA
SYP - Paul Soron, Canada
VOL - Wolfgang Vollman, Austria
The Bright Star Monitor is expected to return to duty after the southwestern USA monsoon ends, normally around the first of September. So we're just a couple of weeks away from beginning to make comparative light curves. Please keep observing! Now is a good time to add some new fields to the program and get some final practice in. For the next update, I'll include observer totals and light curves.
Grigoris Mara suggested the use of the International Meteor Organization's system for estimating limiting magnitude. It's a more accurate system for judging differences between different parts of the sky. However, it is also much more complicated to use. If you are already familiar with the IMO method (http://www.imo.net/visual/major/observation/lm), feel free to include that estimate as well with your reports. If we get enough, I'll do a separate analysis with that data. However, continue to use the little dipper method we adopted for this project.
110728 - By luck, the sequences for W Lyr and S UMi were updated by the sequence team last week. So I have replaced the sample chart IDs in the table with new chart IDs. If you had previously downloaded charts for those stars prior to July 23, 2011, then please update your charts!
110721 - We are considering running a 1-2 day intensive campaign of a blue star. This would entail making observations a couple of times per night of a very blue star that is being covered nearly 24/7 by BSM or other photometric sources. If we do such a campaign, we'll announce it here and send e-mails to anyone who is already contributing to this project.