

-L. Campbell and L. Jacchia, 1941, in The Story of Variable Stars
The Most Useful Variable Stars
|

Cepheid variables are undoubtedly one of the most important classes of variable star in the sky. The most outstanding feature of these stars, discovered by Henrietta Leavitt, is the connection between period and luminosity. That is, the longer the period, the more luminous the star. From this relationship, apparent brightness can be found and in turn, the distances to these stars can be determined. Leavitt's finding dramatically increased our view of space. Prior to her work, methods for measuring astronomical distances only spanned about 100 light years. However, distances to Cepheids could be determined up to 10 million light years, giving them the notoriety of being considered the "cosmic yardstick." This became an important rung in the cosmic distance ladder that allowed Edwin Hubble and others to make discoveries that forever changed the view of our galaxy and the universe.
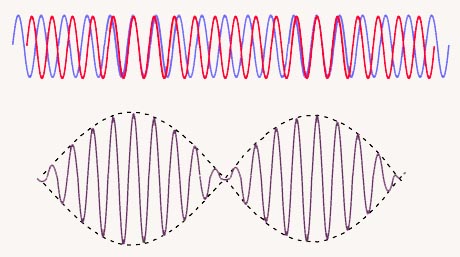
Cepheids are found in the instability strip of the Hertzsprung-Russell diagram and are thought to be the link between the main sequence and red giant phase of stellar evolution. These luminous yellow giant stars derive their variability through radial pulsations in the outer layers of the star. While ordinary Cepheids vary with only one period of pulsation, beat or double-mode Cepheids, display the presence of two or more pulsation periods operating simultaneously. Quite often such modes are the fundamental, with period P0, and the first overtone, with period P1. The interaction between these two pulsation modes is referred to as a "beat" period, Pb, hence their name. According to the General Catalogue of Variable Stars, P0 is typically 2 to 7 days, with P1/P0 ~ 0.71. The double-mode Cepheids are generally found near the low-luminosity end of the Cepheid strip and account for nearly half of all Cepheids in the aforementioned period regime.
Currently, there are just over 20 known beat Cepheids in the Milky Way, and over 50 known in the Large and the Small Magellanic Clouds. The brightest and best observed northern hemisphere double-mode Cepheid is TU Cas, making it one of the most useful beat Cepheids in the night sky.
TU Cassiopeiae...Period
|

Interest in TU Cas began in 1911 when it was discovered by Annie Jump Cannon upon her examination of Harvard College Observatory photographs: "A rapid comparison of various photographs of the Map of the Sky, for the purpose of detecting new stars, has resulted in the discovery of Nova Sagittarii, No. 4, two new variable stars in Map 43, and three new variables in other regions" (Cannon and Pickering 1911). Based on her studies, Cannon reported TU Cas to have a magnitude range of 7.2 to 8.6 and to be of spectral class G, which was later revised by Shapley (1916) to be F1 to F8. Although she did not specify a value, Cannon noted that the period of the variable was short.
Among the first to investigate the periodicity of TU Cas was Zinner (see Sanford 1928 and references therein). Based on his preliminary observations made in 1911, he determined the period to be 59 days. However, his follow-up observations made in 1911 and 1912 could not confirm his determined value. Subsequent studies by Baker (1913) and Van Biesbroeck and Casteels (1914) yielded much shorter periods of 2.137 and 2.139 days, respectively. With its small amplitude, short period, and spectral type, TU Cas was classified as a Cepheid variable.
|
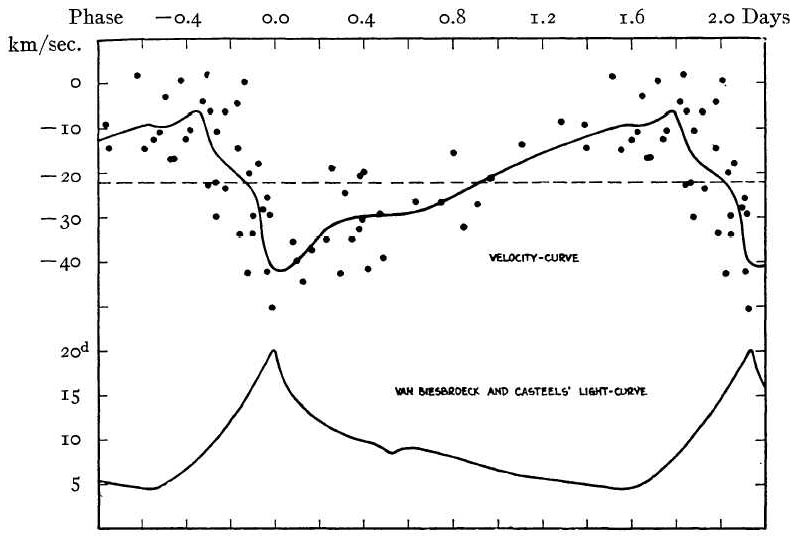
Utilizing the period and observational work of Van Biesbroeck and Casteels (1914) in conjunction with spectrograms of TU Cas made between 1917 and 1928, Sanford (1928) revealed a relationship between minimum radial velocity and maximum light, such that:
Min. velocity (max. light) = J.D. 2421503.158 + 2.d1391E + 0.d259(10-3E)2 (G.M.T.)
With this, Sanford claimed that, "Although the representation is better than that given by a formula of constant period, the irregularity in the resulting plot of the velocities suggests that superposed changes in the period or shape of the velocity-curve may be present." Furthermore, Sanford noted that the failure to attain the same values of light and velocity at successive maxima and minima of light and that the irregularity of the star may be the result of some instability.
The Cepheid to "Beat"
|
Reports of scatter and inconsistancies in maximum magnitude and phase were made by visual, photographic, and photoelectric observers (i.e., Van Biesbroeck and Casteels 1914; Robinson 1928; and Gordon and Kron 1947), as well as by those performing radial velocity work, such as Sanford (1928). Each expressed doubt that the observed phenomenon could be the result of error, which was justified since the detected irregularities in one data set would be confirmed by another.
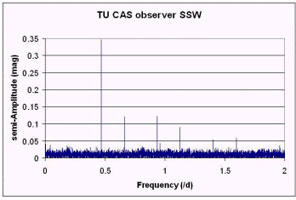
Successful in interpreting similar variations seen in the Cepheid variable U TrA as a beat period, Oosterhoff (1957) applied the same method to TU Cas. Analyzing data composed of his own photoelectric measurements and of earlier published observations, Oosterhoff found evidence of the beat phenomenon in TU Cas, making it the second known double mode Cepheid. Oosterhoff reported the best value for the beat period to be 5.23026 days. Further observations by various observers (see Gieseking and Radeke 1978 and references therein) confirmed the existence of the beat period and proved it to be Pb = 5.230357 days, with the fundamental period of P0 = 2.139298 days, and the relationship 1/P1 - 1/P0 = 1/Pb yielding the secondary period of P1 = 1.518293 days.
A Third Period?
|

In an analysis of the published data prior to 1960, Faulkner (1977) reported confirmation of the two previously reported periods, with his values of P0 = 2.13931 days and P1 = 1.51833 days. In addition, Faulkner's analysis revealed a third, smaller amplitude oscillation of P2 = 1.25246 days. As a follow-up to Faulkner's claim, Gieseking and Radeke (1978) found that their observations could not be represented by using Faulkner's method of analysis and suggested the analytical treatment of data since 1960 be made. Cox et al. (1978) reanalyzed the data used by Faulkner applying his technique and confirmed his result of 1.25 days, but pointed out that the small amplitude of the periodicity made its reality unlikely. Interestingly, when using their own technique with the same data, the third period was not found. Neither was it present when Cox et al. extend the data further with additional published observations. The group concluded that the detection of Faulkner's third period was spurious because of the lack of proper zero point corrections for two data sets of observations. As further support, later observations by Matthews et al. (1992) also did not confirm evidence of the tertiary mode.
Beat Behavior
Although a complete theory for beat Cepheid behavior is still outstanding, several attempts have been made over the years to help describe the phenomenon. One such theory is that of mode-switching. That is, certain short-period pulsators are in transition between the fundamental and first overtone modes. It is thought that evidence of such a transition would show itself as a change in the relative amplitude of the modes. Studies to support this theory have come from such works as that of Hodson et al. (1979) who reported the V amplitude of the first overtone had dropped by about 40%, while fundamental amplitude remained near 0.68 mag in the nearly 70 years of published data included in their inspection. In addition, Niva (1979), covering a similar time interval, reported a comparable effect in the radial velocity data, in that a 25% decrease in amplitude of first overtone was detected, while fundamental amplitude has remained essentially constant since 1917. However, more recent photometric and radial velocity measurements by Matthews et al. (1992) showed no support to the claim of a continuous decline in amplitude of the first overtone. Neither was there a significant change in relative amplitudes, as would be suggested by mode switching. Furthermore, studies of the published observations and those obtained by Mader (1991) (covering a span of 46 years) showed that the amplitude ratio does not seem to display a steady decrease.
|
Alternatively, King et al. (1975) suggested that beat Cepheids may be a class separate from normal short-period Cepheids. The idea was based on the small masses and radii of beat Cepheids obtained by analysis of period ratios. "Because their masses and luminosities do not seem to fit in with traditional PLC [period-luminosity] or M-L [mass-luminosity] relations, we suppose that they can be separated from the classical Cepheids along with some of the problems associated with the latter variables" (King et al. 1975). In the 1990s, however, the mass discrepancy problems were corrected with the Opacity Project (OP) and OPAL when it was found that the error was with the interior opacities. This finding has lead to an important revision of the theoretical stellar models.
Whatever the mechanism responsible for beat Cepheids may be, much can be learned about stars with multiple periods since they reveal something about the interior of the star. Careful studies may yield additional periods, or perhaps even evidence of nonradial oscillations, providing further clues about their nature. It is important for continued monitoring of these stars to so that theorists may test their models on actual observed data.
Observe TU Cassiopeiae
|
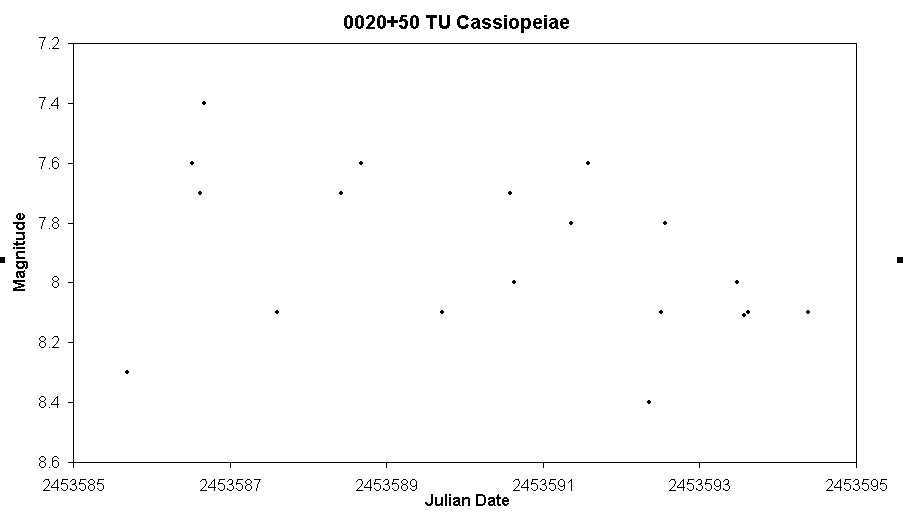
AAVSO observers have consistently monitored TU Cas since the mid 1960s. Based on over 3,500 observations in the AAVSO International Database, the variable has been seen as bright as magnitude 6.5 and as faint as magnitude 8.8. Since very few other beat Cepheids are as well covered, continued monitoring is important to the longevity of the light curve.
With that in mind, (former) AAVSO Director, Dr. Arne Henden, has coordinated a TU Cas observing campaign. Announced in AAVSO Alert Notice 318, Dr. Henden put out the call for visual, PEP, and CCD observers to monitor this important beat Cepheid:
"TU Cas' amplitude is >1 magnitude, making it a possible target for experienced visual observers. Since it is bright, it is an ideal target for PEP observations. CCD data are also welcome, just be sure not to saturate on TU Cas. CCD and PEP observers should use BVRI filters and try to get one image per night. When time permits, time series runs with multifilter observation sets separated by 30 minutes would be useful."
Additionally, he suggests that "A revisit at this date has two advantages: a check on the mode-switching idea, where you need observations about every decade or so to look for such evolutionary trends; and higher precision, dense time coverage to look for multiple periods and light curve structure."
AAVSO charts are available for all modes of observing. PEP observers are asked to use the "89" and the "74" stars as the comparison and check stars, respectively (see AAVSO Alert Notice 319 for more information). Visual and CCD observers should note the comparison stars used, as they normally would for any other observation. Since their periods are short, Cepheids should be observed every clear night, with the time of observation recorded to 4 decimal places. Observers may then submit their observations to the AAVSO International Database, where they can be accessed and used by present and future generations of researchers to help understand the nature of the beat Cepheids.
- AAVSO Alert Notice 318 (June 10, 2005); also see AAVSO Alert Notice 319 (June 22, 2005)
- AAVSO charts for 0020+50 TU Cas
- AAVSO Cepheid Variable Star of the Month/Season features: delta Cephei, zeta Geminorum, X Cygni, and W Virginis
- Baker, Robert H. "Studies with the Polarizing Photometer." Laws Observatory Bulletin, 2, 1913, 47-70.
- Cannon, A. J., and E. C. Pickering. "Nova Sagittarii, No. 4 Five New Variable Stars." Harvard College Observatory Circular, 164, 1911, 1-3.
- Cox, Arthur N., David S. King, and Stephen W. Hodson. "Triple-Mode Cepheid Masses." Astrophysical Journal, 224, 1978, 607-613.
- Faulkner, D. J. "Cepheid Studies II. A Third Period in the Beat Cepheid TU Cassiopeiae." Astrophysical Journal, 218, 1977, 209-219.
- Gieseking, F. and H.W. Radeke. "Photoelectric Observations of the Double-Mode Cepheid TU Cassiopeiae." Astronomy and Astrophysics Supplement Series, 33, 1978, 207-212.
- Gordon, Katherine C., and Gerald E. Kron. "Photoelectric Light-Curves of RR Lyrae, TU Cassiopeiae, and T Monocerotis." Astrophysical Journal, 106, 1947, 318-324.
- Hodson, S. W., A. N. Cox, and R. F. Stellingwerf. "TU Cassiopeiae Periods and Amplitudes." Astrophysical Journal, 229, 1979, 642-651.
- King, David S., Carl J. Hansen, Randy R. Ross, and John P. Cox. "Application of Linear Pulsation Theory to the Cepheid Mass Problem and the Double-Mode Cepheid." Astrophysical Journal, 195, 1975, 467-474.
- Mader, Vicki. "An Amplitude Analysis of TU Cassiopeiae." Journal of the AAVSO, 20, 1991, 77-83.
- Mattews, Jaymie M., Wolfgang P. Gieren, J.D. Fernie, and Nadine Dinshaw. "Reexamining the Beat Cepheid TU Cas: No Second Overtone, No Mode Switching." Astronomical Journal, 104, 1992, 748-757.
- McMaster Cepheid Photometry and Radial Velocity Data Archive, including a list of known beat Cepheids in the Milky Way and the Large and Small Magellanic Clouds
- Niva, Gordon D. "Periods and Amplitudes of TU Cassiopeiae from Radial Velocities." Astrophysical Journal, 232, 1979, L43-L45.
- Oosterhoof, P. Th. "The Light-Variation and the Radial-Velocity Curve of TU Cas Explained in Terms of a Primary Period and a Beat Period." Bulletin of the Astronomical Institute of the Netherlands, 13, 1957, 320-327.
- Robinson, L. V. "The Variable Star TU Cassiopeiae." Harvard College Observatory Bulletin, 866, 1929, 1-5.
- Sanford, Roscoe F. "On the Variation of the Radial Velocity of TU Cassiopeiae." Astrophysical Journal, 68, 1928, 169-175.
- Shapley, H. "The Variations in Spectral Type of Twenty Cepheid Variables." Contributions from the Mount Wilson Observatory, 124, 1916, 1-19.
- Van Biesbroeck, G., and L. Casteels. "Études sur les Étoiles variables." Annales de l'Observatoire royal de Belgique, 13, 1914, 175-338.
This month's Variable Star of the Season was prepared by Kerri Malatesta, AAVSO Technical Assistant.