

Summary of VSP changes
Over the last year or so the chart display in VSP has been completely rewritten. The goal was twofold:
- Switch from the Perl programming language to Python, the main language of the AAVSO infrastructure, and
- Fix several small issues that have cropped up over the years. This was done while trying to keep the new charts as similar as possible to the old charts.
Some minor changes
Let’s take a look at an old and new version of the chart for AG Peg side-by-side to illustrate some of minor changes made to chart layout and annotation:
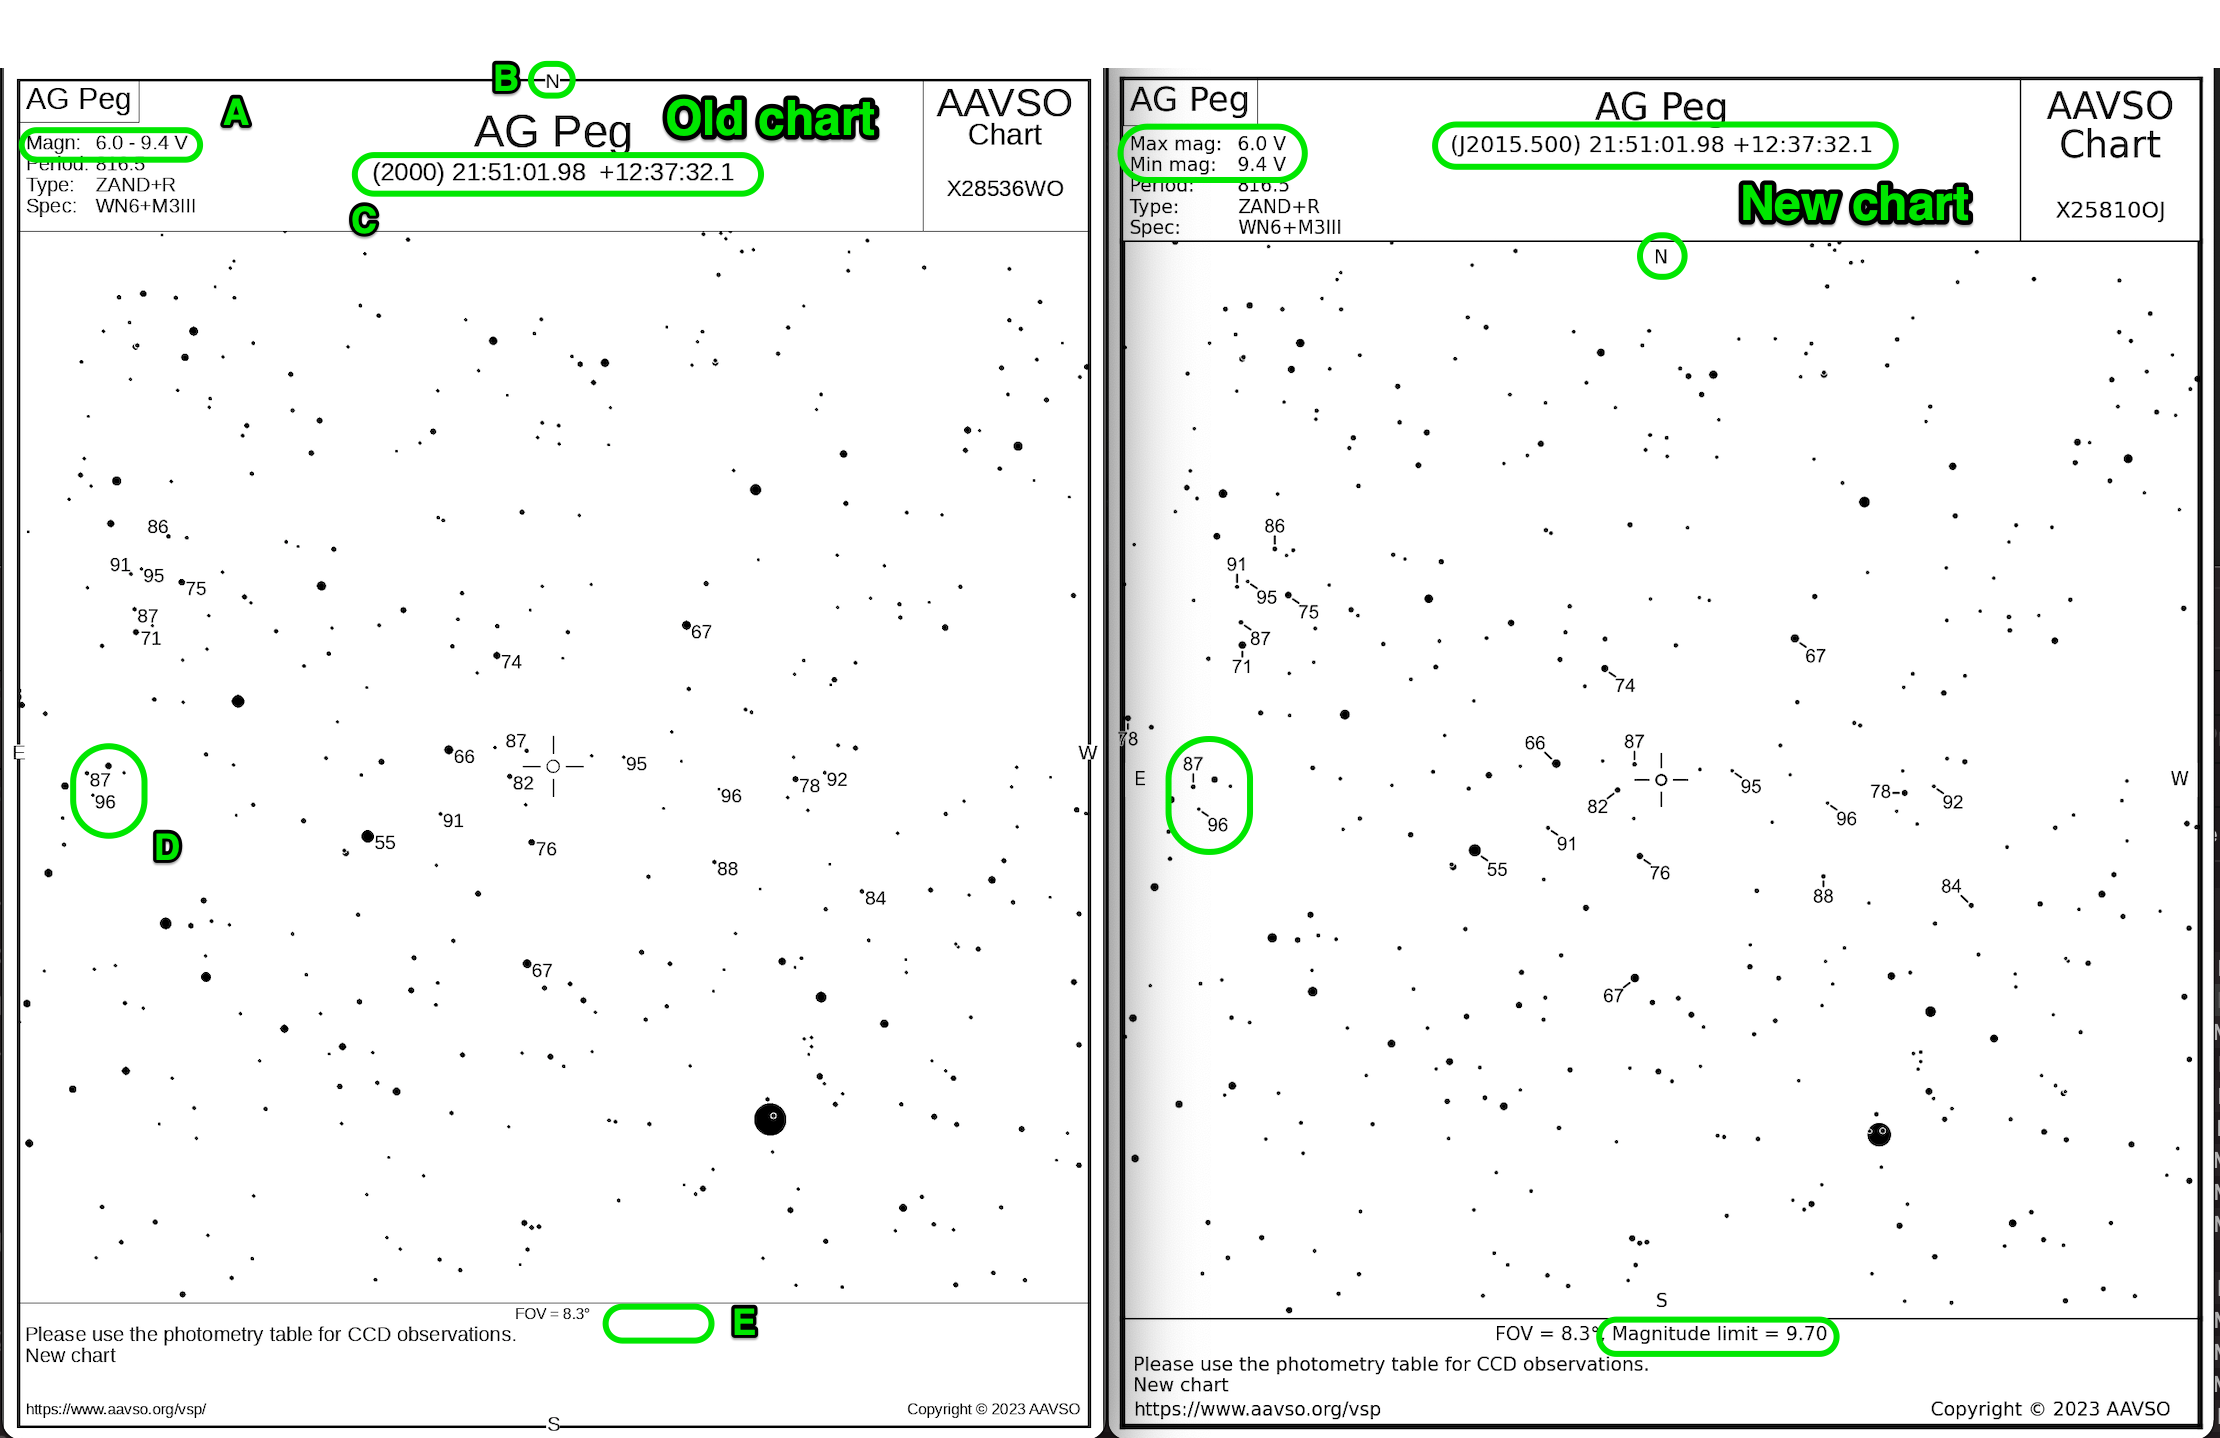
The principal changes are marked in the broad chart above and in more detail below.
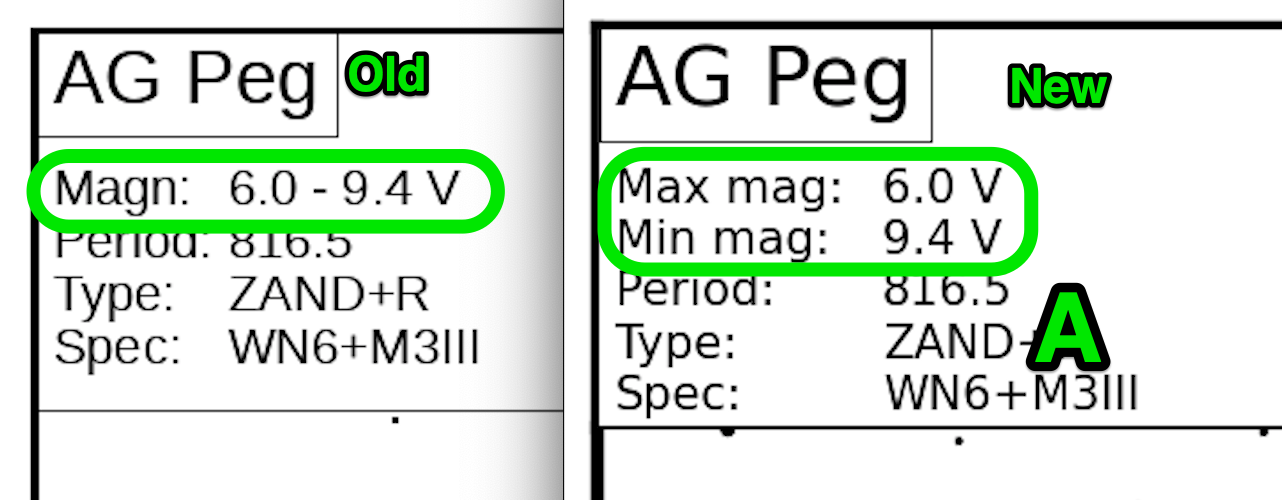
| A. Maximum and minimum magnitudes are on separate lines. |
|---|
 |
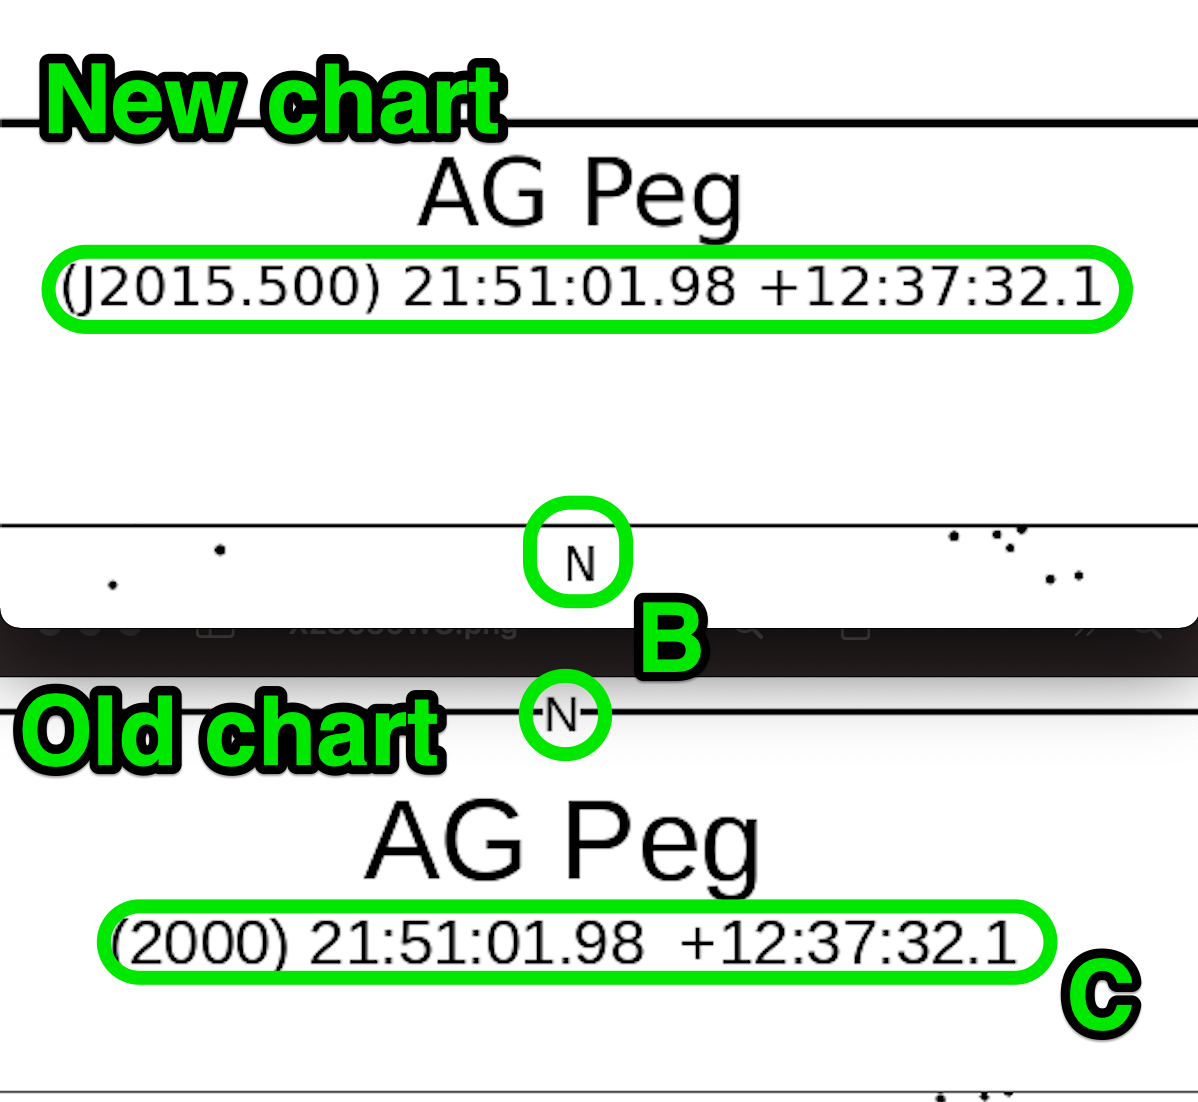
| B. Cardinal directions are in the star chart area now. C. The variable star position is given at J2015.5 when possible, and includes proper motions. When proper motions are not available the J2000 position is shown instead. |
|---|
 |
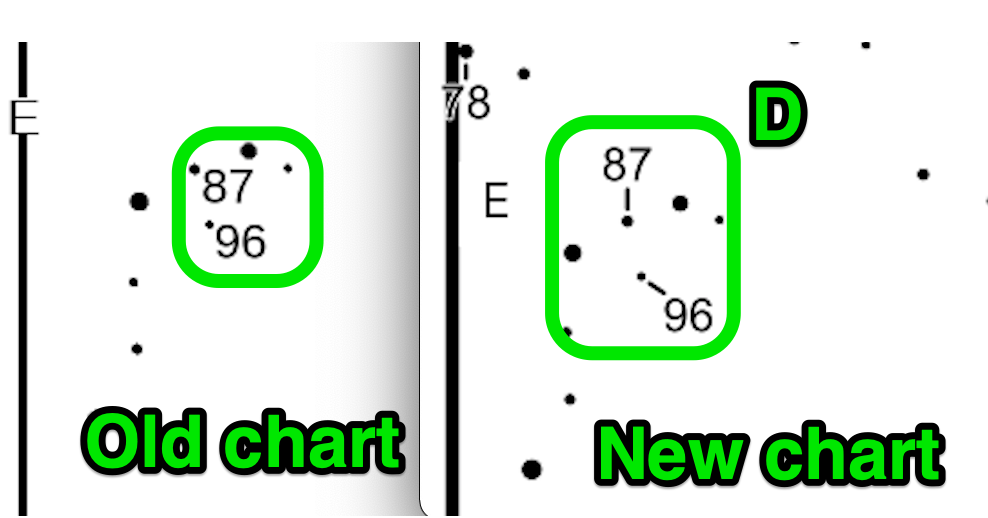
| D. Comparison stars now have a line drawn to their label by default. |
|---|
 |
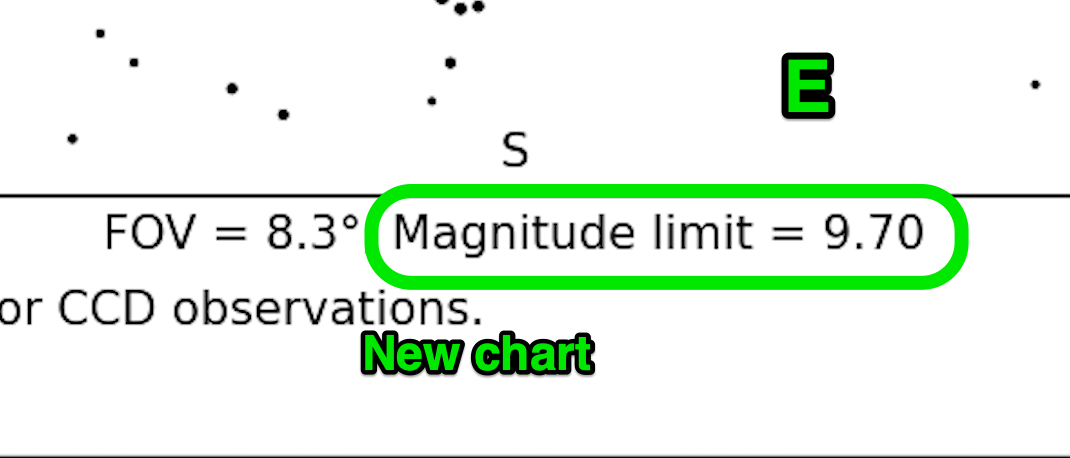
| E. The magnitude limit of the chart is now displayed on the chart. In addition, the font of the text in the bottom area is all the same size. |
|---|
 |
Some changes to accommodate long variable names and crowded fields
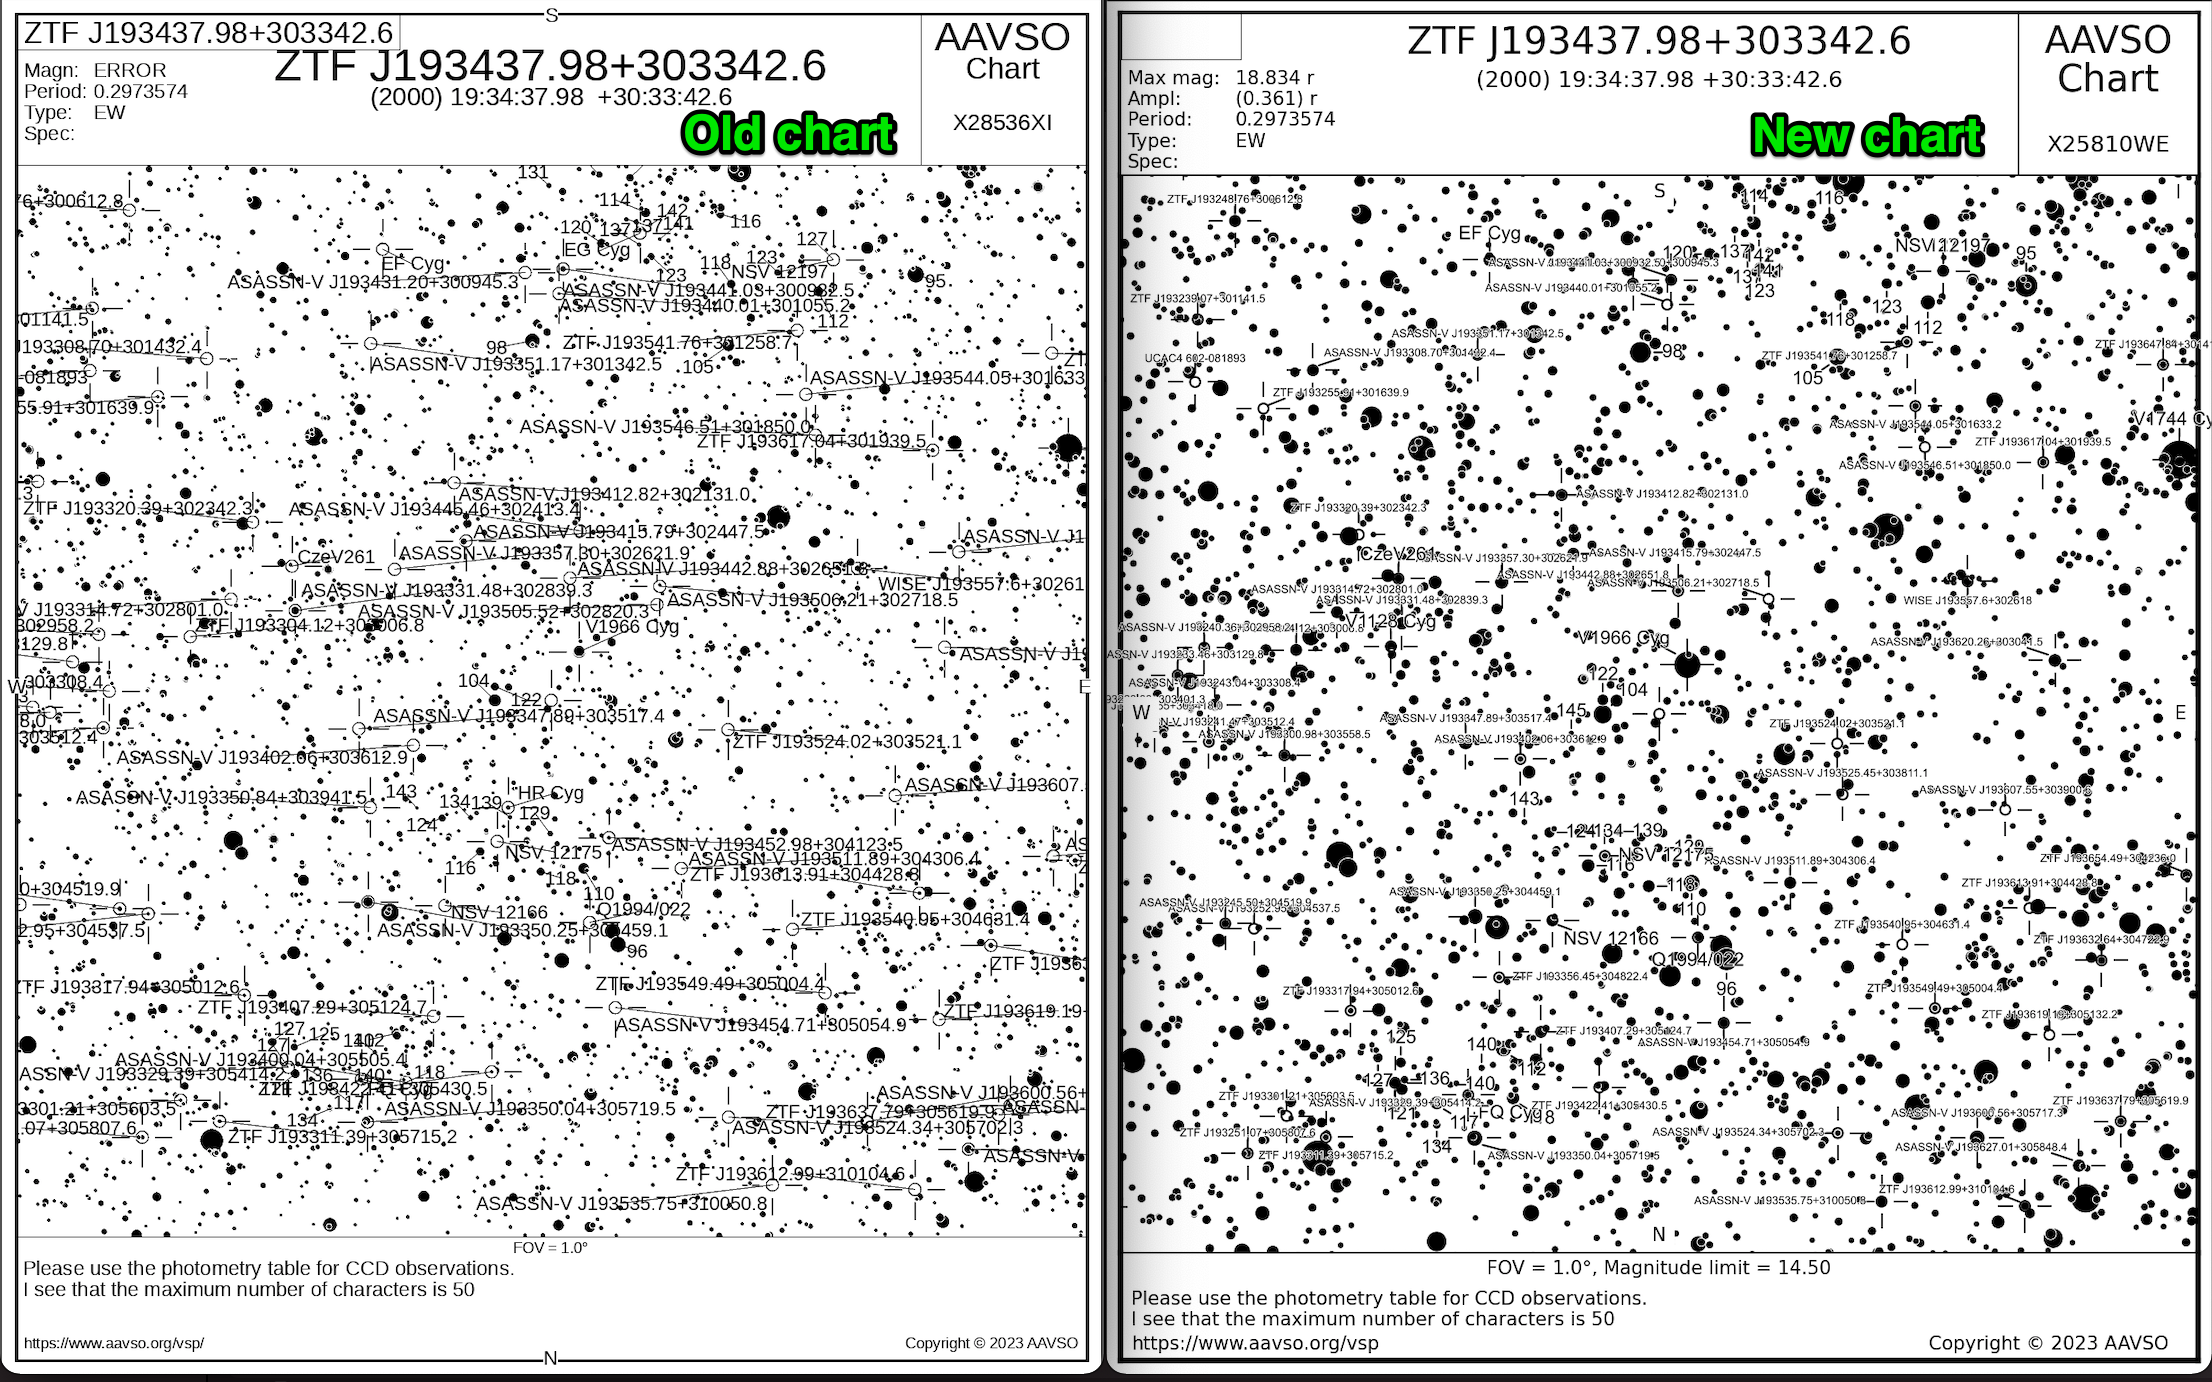
Some charts, like the one below for ZTF J193437.98+303342.6, show some additional changes. One of those changes was forced by the naming convention for variable stars discovered in large surveys: they can be be quite long, in some cases approaching 30 characters.
That is handled in the new charts by using a smaller font size for long variable names. That helped reduce overlap of labels in very dense star fields. Additionally, If the name of star for which the chart is named is very long it is not displayed in the upper left, and is instead shown only in the title.
The pair of charts shown below are an extreme example – it is much too crowded to actually be useful. The way for a user to address this, in both cases, is to use a narrower field of view or a brighter limiting magnitude.
| Crowded field with long variable names Click to open in larger version of the image. |
|---|
 |
More faint stars in more accurate positions
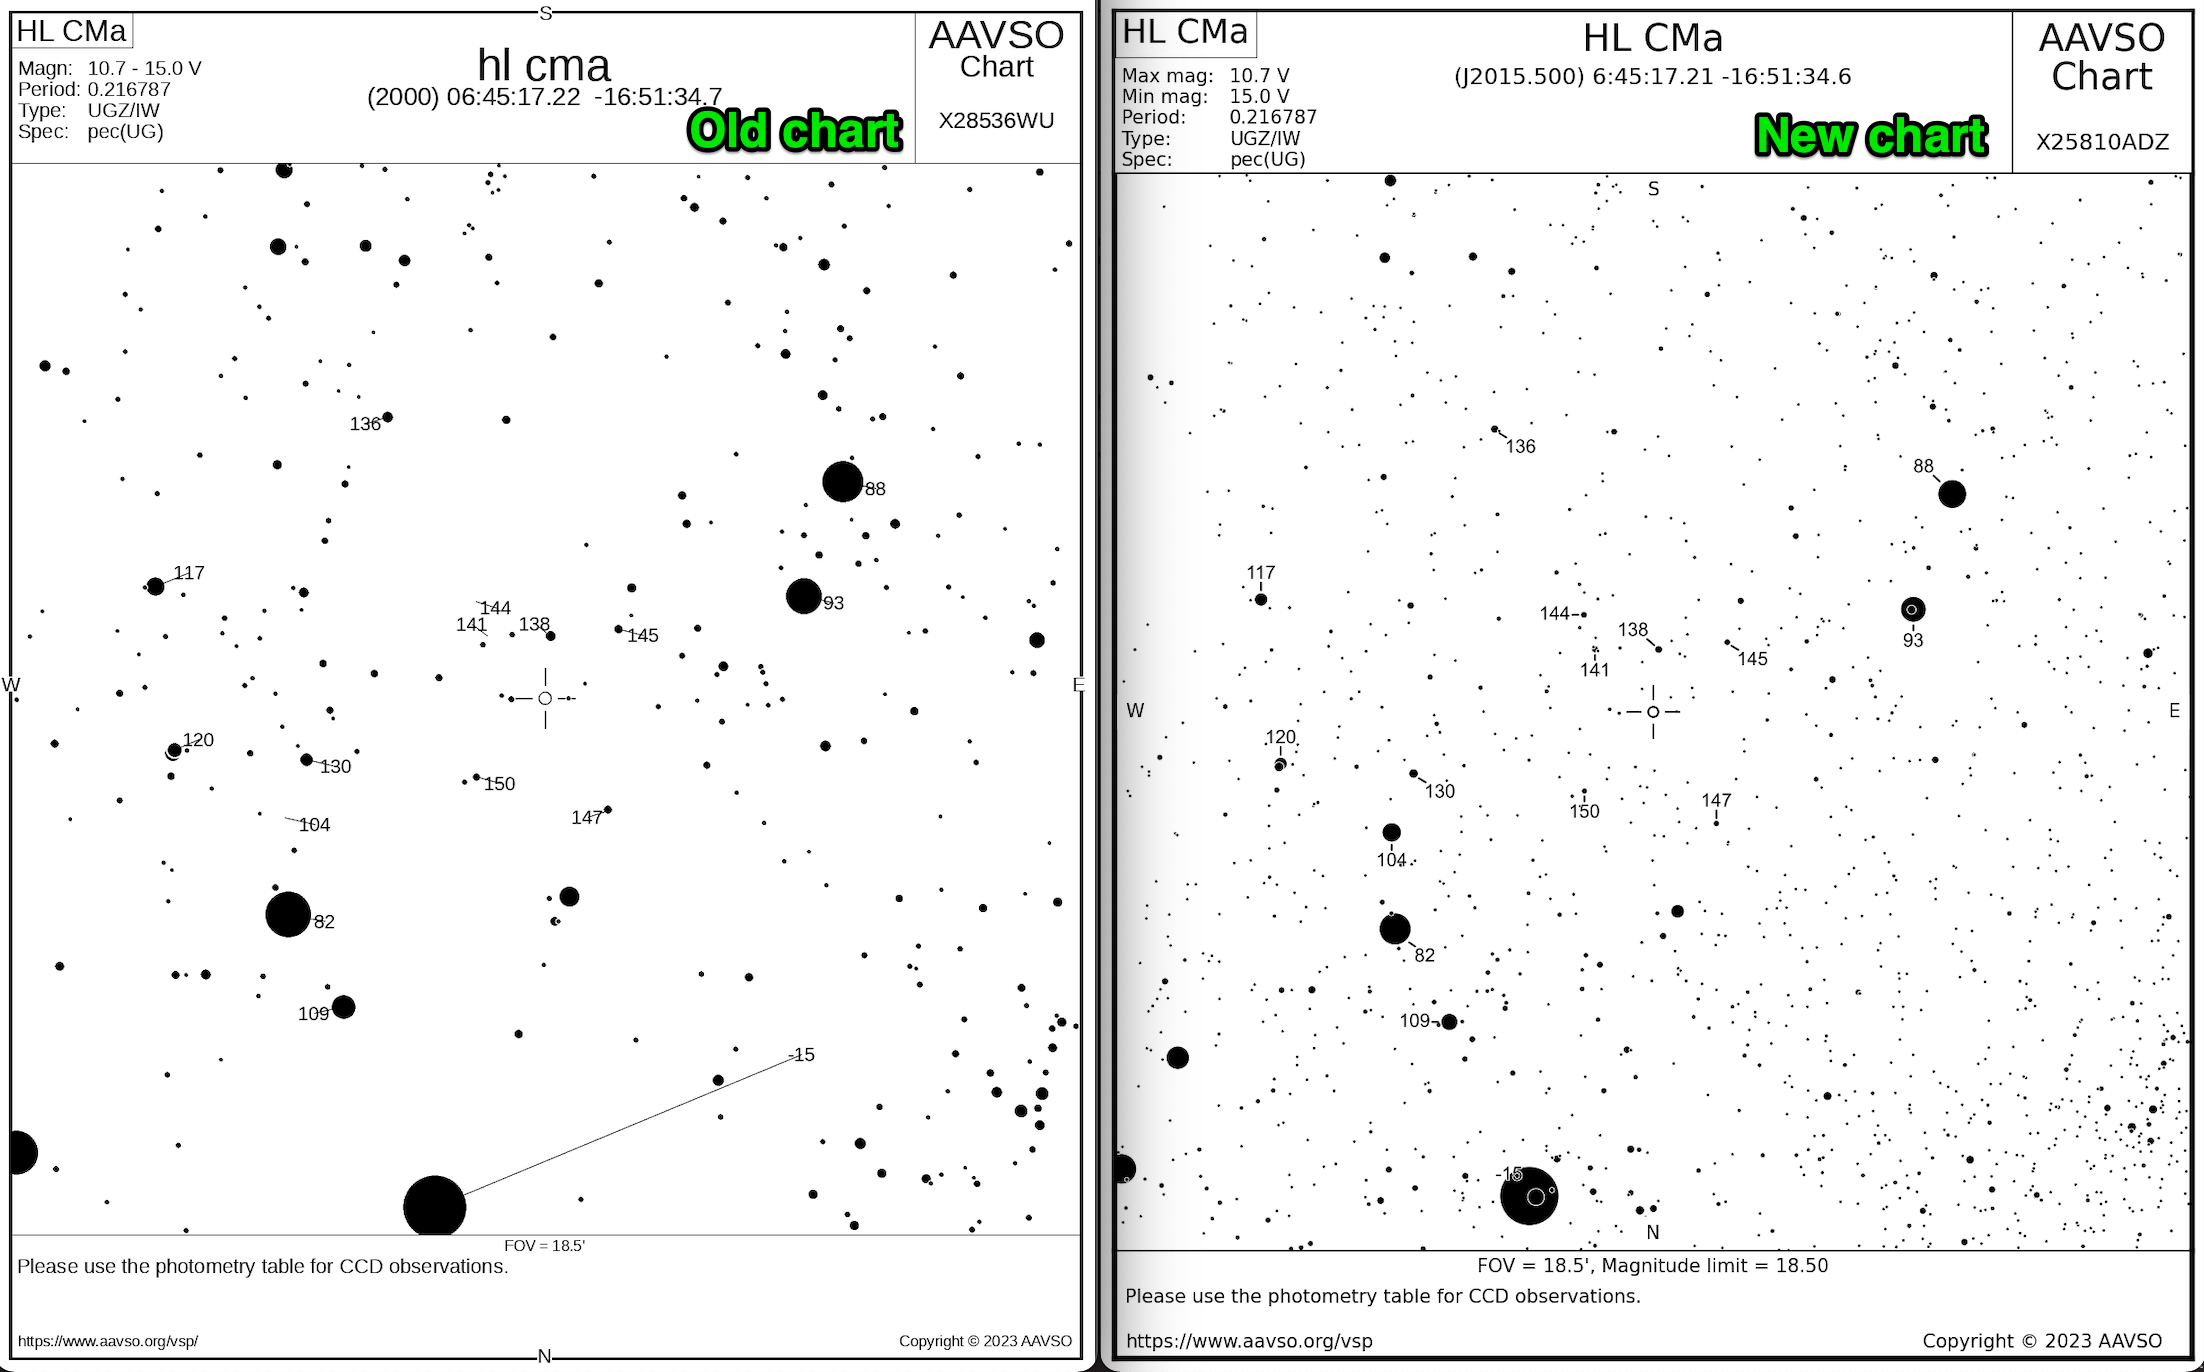
Finally, a pair of charts for CL CMa is below, both with magnitude limit of 18.5. It is apparent that there was a faint magnitude cutoff in the old charts. The new charts use a catalog from the ATLAS survey which extends to fainter magnitudes. Stellar positions in the ATLAS catalog are based on position measured by Gaia, so the charts should be a better match to the sky for variables with high proper motion.
Note that in both cases there are issues with labeling the bright, magnitude -1.5 comparison star (Sirius) in the bottom of the chart.
| Click chart for larger image |
|---|
 |
Acknowledgements
The VSP rewrite was the product of work by Matt Craig, Sara Beck, Sebastián Otero, and Bert Pablo. The astronomical pieces make heavy use of astropy and astroquery. The ATLAS catalog is described by Tonry et al (2018), ApJ 867, No 2.
This tool makes use of the VizieR catalogue access tool, CDS, Strasbourg, France (DOI : 10.26093/cds/vizier). The original description of the VizieR service was published in 2000, A&AS 143, 23