

Light curves are fundamental tools for variable star astronomy. They are relatively simple and easy to grasp. They are simply graphs of brightness (Y axis) vs. time (X axis). Brightness increases as you go up the graph and time advances as you move to the right.
Here is a light curve of a variable star called epsilon Aurigae:
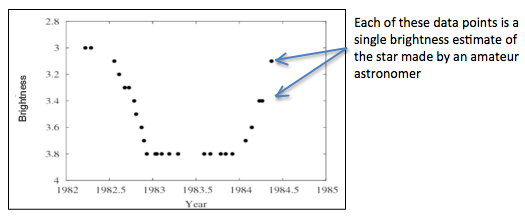
This light curve shows that the star began at a brightness of magnitude 3 in 1982. Around mid-year it began to rapidly dim until it reached brightness of magnitude 3.8 by the end of the year. It remained there until the beginning of 1984 when it began a slower climb back to normal brightness. By the middle of 1984, it was almost back to normal brightness.
That light curve is idealized, in that it was processed to only include the best observations to make it clear. Now let's look a more complicated, real-world light curve. Here is a recent light curve of the bright star Betelgeuse (a.k.a Alpha Ori to astronomers) made with the AAVSO's online light curve generator:
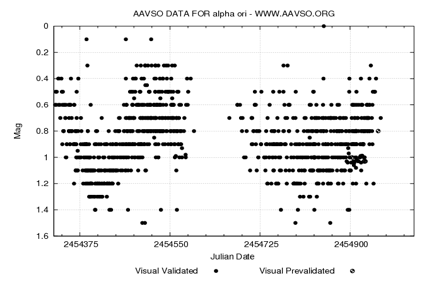
Notice that there are many observations made on the same dates, but they don't agree! That's because we're all human (politicians excepted) and so will make different estimates of a star's brightness. We chose this star as an example because it is very bright and very red. This makes it extra hard for humans to make consistent observations. We call this variation in brightness estimates scatter.
But fear not, we can address the problem with basic statistics! Below is the same light curve, but this time with a red line drawn through it:
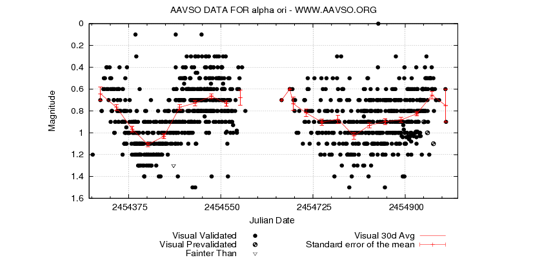
The red line reflects the average observation made at that time. More precisely, we calculated an average brightness of the star in 30-day increments. Then the light curve generator drew a line between the average points. The vertical red bars you see along the line is an error estimate. It's a statistical value that provides an idea of how much you can trust the red line. (There is a 67% chance that the real data falls within that horizontal error - a common benchmark scientists use.)
A good rule of thumb is to see if you can draw a horizontal and straight line between the error bars. If you can, it means there is no real variation in the data. If you cannot, then you can be confident the variation is real. If you can, it means there is no clear variation in the data. There may still be real variation, but you'll need more analysis to prove it. Can you draw a straight, horizontal line between the error bars in that light curve? Try it by holding a sheet of paper up to your monitor.
Notice in the first set of data in the light curve that you cannot draw such a line. But you can in most of the data in the second set! That is because the second set is noisier (i.e. has more scatter) and we are less confident it shows variation. There are lots of things you can do to try to lower the error bars in that data, but we'll save that for future discussions. But the best thing we can do is gather more high quality data. This is why we almost always need more observations. The more we have, the more we can beat down those error bars. It's also important to take your time to make a quality observation.
We have a more detailed description of light curves and basic analysis in Chapter 11 (PDF) of our online Variable Star Astronomy curriculum.