

Hi all,
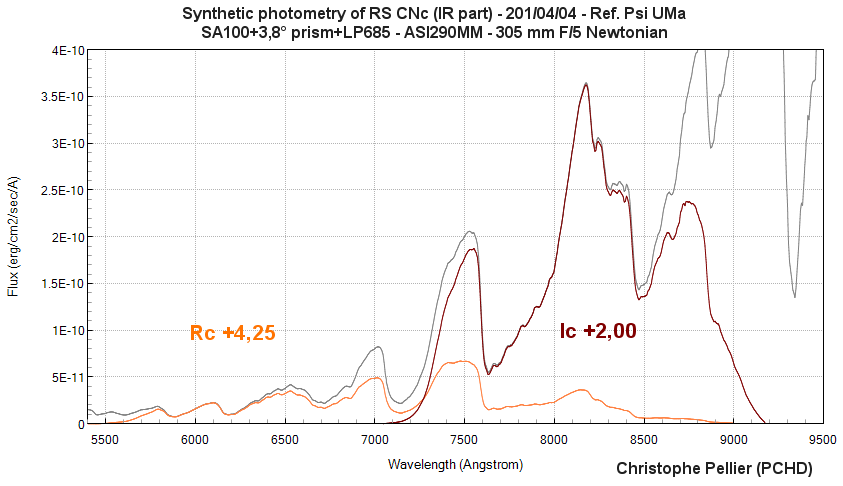
After a first contribution on Betelgeuse last year, I have submitted an observation of the carbon star RS CNc made on April 04th. I am using a SA100 grating with a 3,8° prism and a 685 nm longpass filter of order to build spectra that typically go from 3500 A (UV) to 9500/10000 A (IR) and a custom method derived from the CCD photometry guide to calculate synthetic photometry on BVRcIc bands.
The spectrum of this star (BTW the most beautiful I have seen this far) is so unequal in intensity that I have made three charts so that the B and V bands are not over-flattened in comparison with R and I.
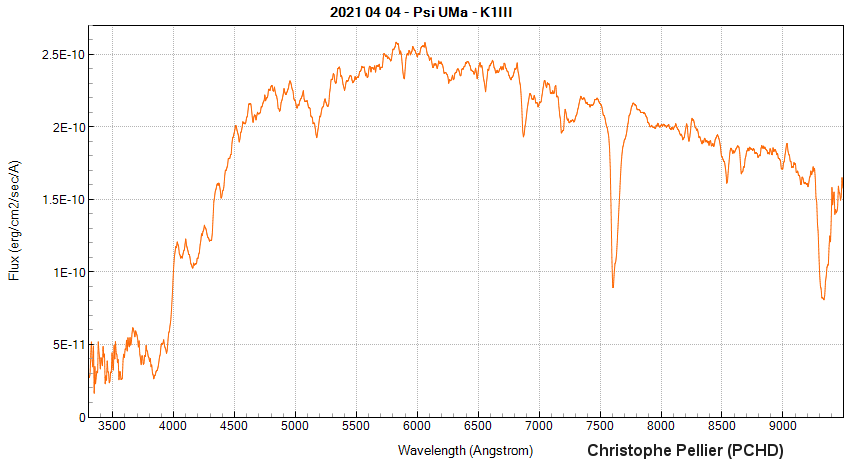
I add as well a spectrum of the main reference star used (Psi UMa)
Spectra are displayed in flux but the calculations are made on uncorrected spectra.
BVRI values found for the 4th of April are in coherence with the AAVSO curves, although some scatter exists in R and I.
Christophe
Greetings Christophe,
Can you describe your technique for deriving the synthetic photometry? Or point to a reference; I didn't see anything in the CCD Photometry Guide.
This is pretty cool.
Thanks,
George
It is basically…
Hi George,
It is basically the same thing than in the guide : calculating BVRI magnitudes by the measurement of fluxes through filters, thanks to the equation described in the chapter 6 of the guide, and the two color coefficients - except that in this case I'm not using glass filters, but synthetic filters applied on a spectrum.
This is a simplified method than the flux method described in Christian Buil's pages (see also Robin's answer), because I'm not using corrected flux spectra for the calculation. My spectra are just identical to what you measure with glass filters: uncorrected from the instrumental response, but I do measure the brigthness of the target in a band of color, in relation with the exposure in time.
The only difference is that I'm using custom magnitude transform coefficients. When I try to calculate the coefficients, the color transforms are easy to get (observing a range of stars from type A to type K), but the magnitude transforms just don't work, and I have no explanation.
My (experimental...) method is to use two reference non-variable stars for the second coefficient observed at the same airmass. I calculate by hand which values will match the magnitudes of the second star, starting from the first one. And then I apply the same coefficients to calculate the magnitudes of the variable star starting from the second non-variable. I admit I don't know why, but it looks to work quite correctly. I suspect the second coefficient is more sensitive to the differences of airmass but this is beyond my current level of understanding.
This is similar to something I touched on at the joint BAA/AAVSO meeting in 2018. Not sure if it is on the AAVSO website but the video can be viewed on the BAA website here
https://britastro.org/video/13862/14769
If you can arrange a spectrum of a comparison star in the same field it can be a useful technique for following fast transients spectroscopically and in multiple photometric passbands simultaneously eg as Andrew Smith is doing on flare stars here
https://britastro.org/journal_item/22498
In general though conventional photometry using filters is simpler and indeed the reverse is more often done, using photometric measurements to calibrate spectra in absolute flux
Cheers
Robin
I did not saw the…
Hi Robin,
I did not saw the video (I did watched it tonight) but I have already read your website quite often and saw this amazing observation of DN Tau.
I am in parallel experimenting the complete flux method (described in Christian's pages), but so far it looks more complicated. I think this method requires the use of the real spectrum of the reference star, and its seems to be rare to find one, or I have not found all the sources. There are many spectra in the ISIS databases but for examples many Miles stars stop around 750 nm so you don't have the IR part (and not fully R).
For my current values of RS CNc, and using the spectrum of Psi UMa (K1III) as if it was a purely Pickles K1III star, the values I find are:
My method: B 7,84 V 6,11 R 4,25 I 2,00
Flux method: B 7,89 V 6,19 R 4,16 I 3,00
So quite close and still more or less on track with the values... except for IR which just look completely wrong.
I'm not really proposing a new method of variable star observing, just playing with the equipment, and experimentating the methods, it's fun. Spectro-photometry could be an interesting way to observe bright stars though, those that too often saturate when doing glass filter photometry.
PS the Star Analyzer is none the less a quite under-rated tool in my eyes, providing that you couple it with the 3,8° prism, which is really improving the quality of the data!
One limitation that I have not found a good solution to with slitless spectra is correcting for flat field effects. This is important if you are measuring target and reference in the same field (like differential photometry) . If you measure the reference separate from the target you can get round the problem by placing the spectra in the same position in the field. Extinction effects become first order though if you are trying to measure absolute flux compared with calibrating spectra in relative flux so you then need stable (photometric) sky conditions, like in all sky photometry.
Hello Christophe,
It is a pleasure to read the results of photometric experiments using SA100 spectra.
Since last year, I have also been experimenting with photometry derived from SA100 spectra + synthetic filters B, V and R.
See Z UMA curve from March to May 2020. DPHA observer.
Equipment used: Newton 150 F5 on Bresser exos2 mount - star analyzer 100 - ASI178MM camera - Sharpcap
The method I use is a bit derived from the sequences of the PEP observers:
a) comparison star 1 sample
b) star variable 3 samples
c) check star 1 sample
d) star variable 3 samples
e) comparison star 1 sample
The magnitudes of the first series b) are calculated based on the magnitude of the comparison star a)
The magnitudes of the second series d) are calculated based on the magnitude of the comparison star e)
The magnitude of the check star c) is calculated twice. Respectively with the comparison star a) and b): used to check the photometric stability of the sky.
The variable star magnitude + error is based on the average of the magnitudes of the six samples.
Like Christophe, the flux is not corrected.
During measurements, the stars (zero order) are systematically placed in the center of the sensor in order to avoid the effect of flatfields.
The results are quite consistent with the AAVSO curve. Note the difference in the slope of the R measurements for which I have no explanation at this stage.
Regards,
Philippe
This looks to…
Hi Philippe,
This looks to be an excellent job! I rarely can follow a star for so "long", unfortunately...
The PEP procedure looks interesting - certainly making redondant measures can bring security for the results.
I don't know if the difference in slope is that a problem. R band measurements look very tricky. In particular, the magnitude of reference in that color can differ quite much following the catalogue they come from. I see that the ref star that you used has a R value coming from the WBVR catalogue, for which a slightly redder passband is adopted in comparison with Cousin R. For very red stars, that can bring quite much incertainty and variations in the results, I think...
I do also always place the spectra in the center of the camera field like Robin suggests. I am still using a classical flat field such as one you use for direct imaging, just to correct for vignetting effects.
I none the less use a particular response to correct the spectra (after the photometry, or to test for flux photometry like in the C Buil method), because in the IR part the sensor of the camera has a particularly "wavy" response (see link) this can effectively extract the IR spectrum, such as the paschen bands in the A stars.
http://www.astrosurf.com/pellier/pellier_response.PNG