


Hi,
I have a nice lightcurve of a DSCT named AD CMi. For determining the maximum i tried:
VSTAR Polynoms 9,12,15 degree
VStar Fourier Fit 3 grade
Bob Nelsons Minima27 Fourier Fit
Gnuplot Fourier Fit grade
Normally I take a mean of some of the nicest Polynoms.
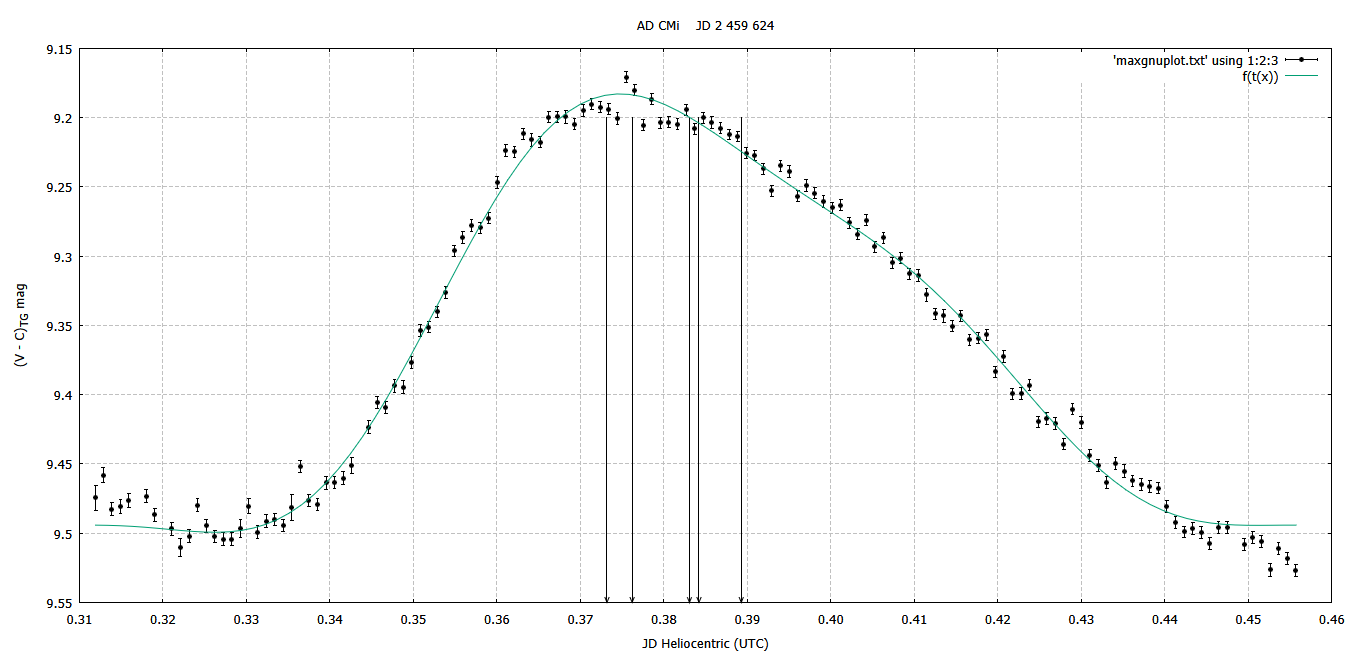
Picture: V-C CMI AD gnuplot fourierfit.PNG From the left, there are five arrows for the max. (The solid blue fit is from the GNUPLOT Fourier Fit)
1st Arrow (from the left) is the VSTAR Polynom 15 degree
2nd Arrow (from the left) is the VSTAR Polynom 9 degree
3rd Arrow (from the left) is the Fourier Fit Bob Nelsons Minima 2.7
4th Arrow (from the left) is the Fourier VSTAR 3 grade
5th Arrow (from the left) is the Fourier FIT GNUPLOT 3 grade
QUESTION:
- Why are the Fourierfits differing that much from the Polynoms?
- How is the proper way to calculate a correct maximum?
see also:
https://www.aavso.org/LCGv2/index.htm?DateFormat=Julian&RequestedBands=&view=api.delim&ident=ad cmi&fromjd=2458913&tojd=2459643.047&delimiter=@@@
Here are my results:
JD: 2459624,37619, Mag: 9,184601 [Maximum] 9 Polynom
RMS: 0,010486
AIC: -1239,940579
BIC: -1213,595296
JD: 2459624,37359, Mag: 9,186395 [Maximum] 12 Polynom
RMS: 0,008823
AIC: -1281,591163
BIC: -1246,464119
JD: 2459624,37318, Mag: 9,188794 [Maximum] 15 Polynom
RMS: 0,008658
AIC: -1280,784898
BIC: -1236,876092
FOURIER FITS
0,38306 fourier MINIMA 2.7
0,3842 Fourier 3 grad VSTAR 2.21.3
0.389263 Fourier 3 grad GNUPOT
The DIFFERENCE form the different results is: 0,389263 - 0,37318 = 0.016083 HJD are 0.385992 h = 23.15952 min
Bernhard:
I suspect that the value produced using Minima 2.7 is an outlier for some reason. Your data produced the following results using Peranso 3.0.3.4: (Poly 6) 0.3744871 ±0.0014859 Brightness 9.188. MAVKA (https://www.ta3.sk/caosp/Eedition/FullTexts/vol50no2/pp557-559.pdf) features a large number of fitting options which I've found to be very useful for HADS variables and totally eclipsing overcontact binaries. In this case the best fit (0.0079) was obtained using the "parabolic spline approximation" in which the time of extremum was 0.37462 ±0.00123 at mag 9.19 ±0.003.
The Fourier fits will depend on the starting and ending positions that have been selected for curve fitting. I normally start and end the curve fit at half the amplitude but more importantly just be consistent with the software and fitting algorithm you are using for each variable star.
Kevin
Thank you Kevin,
For looking into my data. Hmm.. Maybe Peranso is a try worth it...
I've downloaded MAVKA https://uavso.org.ua/mavka/
It is sounding promising!
InputFile=
max.dat
OutFile=
max.da$
Parabolic spline approximation
linear coef 5
nonlinear coef 2
sigm 0.0121829292395493
time of extremum 2459624.3775955 -+0.000450692323739213
mag of extremum 9.18192711187491
-+0.00259315648316741
Bernhard
I can comment…
Bernhard,
I can comment only on the VStar data. It seems that you may have selected the entire light curve on which to perform the polynomial fits. This is not necessary, since you are interested only in determining the time of maximum (TOM). I suggest that you experiment with selecting (displaying) a more limited parts of the light curve, for example about half of the ascending and descending limbs and the peak, then in the View menu select Filter from Plot. Fit the polynomials to this filtered dataset.
I then fit polynomials starting with 4th order, and increasing (5th, 6th, etc) until it is clear the AIC reaches a minimum value (e.g, if AIC values were -281, -283, -284, -282, then -284 is the minimum value). VStar gives an RMS error. This is the root mean square of the residuals, which is not an error estimation of the actual TOM. In order to obtain the latter, you need to use Peranso or some other software.
I use Peranso. If you note the range of HJD values you used for your polynomial fit in VStar, note the polynomial order, then use those values in Peranso, you will find a TOM (it should be identical to that obtained in VStar) and an error estimation of the time.
Just a note on AIC. I use this and not BIC in VStar because limited experiments I've done indicate that, after fitting polynomials to several different parts of a light curve around the peak or trough, noting the AIC and BIC, then noting the TOM, the range of times is smaller using AIC than it is for BIC. In other words, in that experiment, AIC was less sensitive to the actual part of the light curve selected for polynomial fitting than was BIC.
Roy
By the…
Thank you all!
By the way, if I perform only a partly Fourier-Fit, e.g. like the Nike LOGO, the Fourier is working better!