

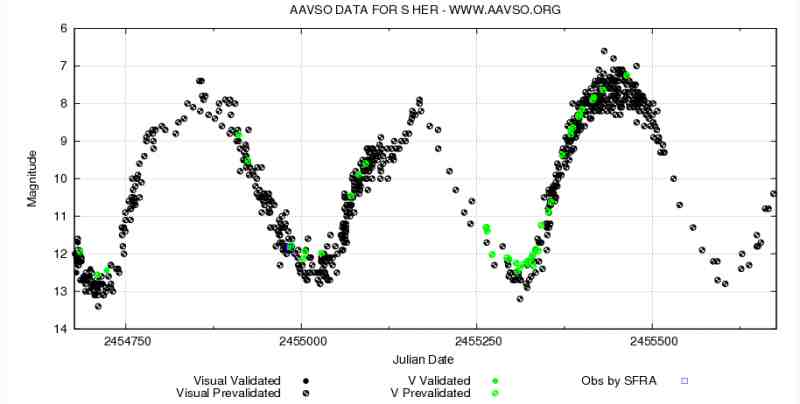
Last 1000 days from the AAVSO db (4/24/2011)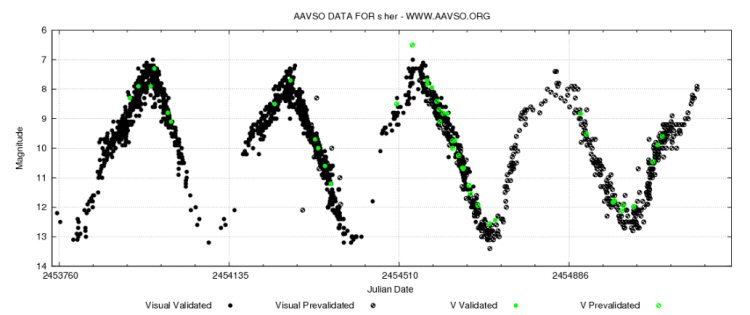
Last 1500 days from the AAVSO DB
When you see the visual light curve have a blob on the rising curve it can be an indicator of a hump
| cycle | Start of Hump (JD) | Days between "hump" starts | End of "hump" (JD) | Length of hump | Date of maxima at start of this cycle | Days between Maxima | Days from Mxima to start of "hump" |
| cycle+1 | |||||||
| current | |||||||
| cycle-1 | |||||||
| cycle-2 | |||||||
| cycle-3 | |||||||
| cycle-4 | |||||||
| cycle-5 | |||||||
| cycle-6 | |||||||
| cycle-7 |