

Y Per
by Rich Roberts
Y Per is a unique carbon star (C4,3e(R4e)) with a long history of AAVSO coverage. Y Per is located at RA 3:27:42.39 and DEC +44:10:36.5, so it can only be enjoyed by those of us in the Northern Hemisphere. Y Per is listed as a Mira star in VSX; however, this may no longer be the case. VSX also lists the magnitude range from 8.1 to 11.3; however, in the last 10 years the star has ranged between 8.5 and 10.5. The AID currently holds 34,941 observations (88.6% of which are visual) from 1,091 different observers dating back to 1904. 1,571 of the observations are in Johnson V and 318 in Johnson B. Y Per is a Legacy LPV. Legacy LPVs are the top 101 LPVs for which the AAVSO has tens of thousands of observations spanning several decades and which continued visual observations will remain scientifically relevant into the future. Below is the light curve from all of the AID’s visual and Johnson V observations loaded into VStar

From looking at this, you can easily see that Y Per’s amplitude has decreased. Kiss et al. (2000) noticed this while performing long term (70-90 year) visual magnitude studies utilizing AAVSO data. They found Y Per was a well-behaved Mira showing no signs of peculiarity until 1987. The abruptness of the change was unique. Other stars in their study (V Boo, R Dor, RU Cyg for example) generally took approximately 10 cycles (from a few hundred to a few thousand days) to gradually make a such a transition. Y Per seemingly changed from a Mira to a SR with a snap of the finger. Studying the last 10 cycles, you can see this star no longer looks like a Mira. It also shows some evidence of dual-maxima, but this needs to be further investigated.

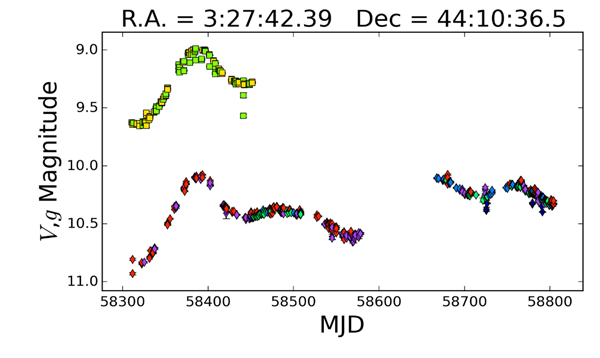
Below is the last 500 days (about 2 cycles) from ASAS-SN in V and G Band. Again, Y Per does not look like a normal Mira.
Marsakova & Andronov (1998) studied 35 Miras and Y Per was the only star in the study to show district periods of Mira and SR type variability. Y Per’s change in behavior was observed at JD 2447700 with evidence of double maximas occurring after that date, although the value of the mean period did not change (Marsakova 1999). Marsakova & Andronov (1998) published the observed maxima and minima from JD 2434700 to JD 2451107 and delineated the periods or Mira Behavior and SR Behavior. I plotted this data in Excel and separated the Mira and SR behaviors by color in the plot. There appeared to be some cyclical fluctuation in the max and min values when the star was exhibiting Mira behavior. The values of the maxima and minima in the SR region of the graph are clearly starting to come together.

Below is a WWZ analysis of visual data for amplitude over time. The mean appears steady until about JD 2447000 when Y Per started to change its behavior.

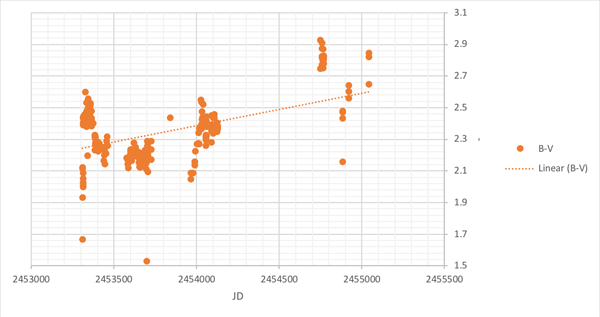
I loaded in Excel all of the Johnson V observations which had a corresponding Johnson B observation in order to track B-V over time. A vast majority of the B and V data came from Dale Mais (MVD) who regularly observed the star from JD 2453309 to 2454127. The most recent B-V data (from 2454759 on) came from Ray Tomlin (TRE). The correlation isn’t very strong, but the star does appear to become redder (B-V is increasing) over time. More data will be needed to verify this trend.
An increasing B-V indicates that the star is cooling. Percy (2007) makes several generalizations about pulsating red giants that relate to temperature:
- The cooler and larger the giant, the larger the amplitude of variability; the rare, large-amplitude Mira stars are the most extreme.
- The cooler the giant, the longer the period; the periods are consistent with low-order radial pulsation.
- Pulsating red giants—especially the smaller-amplitude ones—tend to be semi-regular, though there are usually one or more strict periods present.
It appears that Y Per may be bucking the trend when relating to temperature and amplitude since the amplitude is clearly shrinking. However, this may not be the case since the temperature trend is much less clear due to the sparseness of the B-V data, which leads to a weak correlation. Also, Percy (2007) states that the traditional B-V measurement may not be a great temperature indicator for such cool stars since they radiate most of their energy in the infrared. Hopefully, AAVSO observers can add more of this data in order to determine if this is a real trend or not.
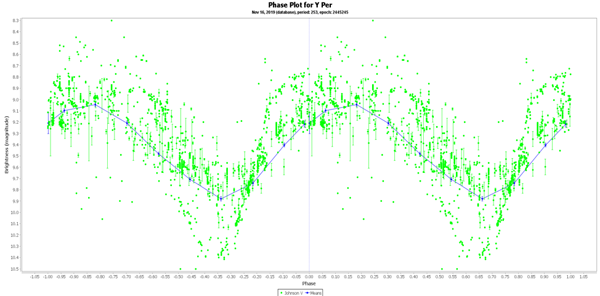
VSX lists Y Per’s period as 248.6 days. Kiss et al (2000) found periods of 245 and 127 days. Marsakova & Andronov (2014) also saw signs of multi-periodicity in Y Per as well by analyzing AAVSO data and reported periods of 253 days and 149.4 days. This period ratio 1.7 was consistent with the other stars in the study. However, Percy and Huang (2015) found Y Per to be monoperiodic at 252.9 days. They specifically looked for the 127 day period reported by Kiss, but it did not stand out in the results. Utilizing VStar, I found the strongest evidence for a 253 day period.

This does show some evidence of a possible period around the 149 day mark similar to that reported by Marsakova & Andronov (2014). I created phase plots for all the reported periods and the 253 day period was the only one which did not come back as a garbled mess.
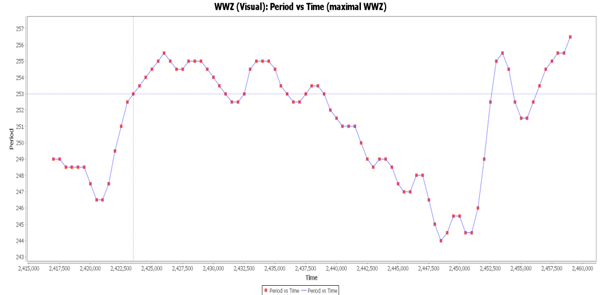
A WWZ analysis of period vs time on Y Per’s visual data shows the period “meandering”, which is typical for carbon stars. The low (shortest period) is also about the time Y Per switched from Mira behavior to SR behavior. It will be interesting to see if the period is currently at a top (longest period) and will come back down or continue to increase from here. As noted below, a cooler temperature generally indicates a longer period. Will the period continue to increase from here and is actually cooling or are we at an inflection point at the normal period meandering? We’ll need to continue observing to find out.
In conclusion, Y Per is a star AAVSO observers should continue to monitor both visually and photometrically. The star is exhibiting long term changes in its behavior which need to be monitored so they can be understood. Only a modest scope is required to observe Y Per through its entire magnitude range. It also has several suitable comparison stars within half of a degree making it a good star for visual observers. These visual observations will be required to monitor changes in the period and amplitude. Increasing precise V-Band monitoring will determine whether this star does in fact exhibit dual-maximum behavior. Additionally adding Johnson B observations to the V band photometry will be useful in determining the star’s nature and hopefully more photometrists will add this star to their program.
References
Benn, D. 2012, “Algorithm + Observation = VStar” JAAVSO, V40, pp. 853-866.
Kiss, L., Szatmary, K., Szabo, GY., Mattei, J. Multiperodicity in Semiregular Variables. Astronomy and Astrophysics. June 6, 2000.
Marsakova, V. & Andronov, I. Catalogue of Main Characteristics of Individual Pulsation Cycles of 35 Mira-Type Stars. Odessa Astronomical Publications. Vol. 11, 1998.
Marsakova, V. & Andronov, I. Miras or SRAs – The Transient Type Variables. Czetochowski Kalendarz Astoronomiczny. 2014.
Marsakova, V. Strong Changes of the Photometric Behavior of Carbon Miras. Odessa Astronomical Publications. Vol. 12, 1999.
Percy, J. (2007). Understanding Variable Stars. New York, NY: Cambridge University Press.
Percy, J. & Huang D. Pulsation Properties of Carbon and Oxygen Red Giants. JAAVSO. Vol. 43, 2015.