

Update (July 7, 2015): I-band coverage of QX Pup by AAVSO observers since 2010 clearly shows that the period given in the 4th Edition of the GCVS of 648: days is incorrect. A phase plot by Sebastián Otero of these data shows that the period of QX Pup in Ic is 551 days.
The Field of QX Pup
This is a multiple set of projects, so pick and choose what aspects of them interest you.
Introduction
Project 1: QX Pup
Project 2: The open cluster M46
Project 3: The Planetary nebula NGC 2438
Project 4: What is your visual estimate accuracy?
Project 5: What is your CCD estimate accuracy?
Project 6: Rough determination of your transformation coefficients
Introduction
I got interested in QX Pup on January 16, 2001, when Moran Nachshony at Givatayim Observatory announced on the yahoo group, ccd-astrometry-photometry, the discovery of a bright variable star near the open cluster M46. They were observing with a 40cm telescope, but using unfiltered CCD images. Knowing that such images often saw bright red sources that don't appear as bright on photographic surveys, I followed up with a UBVRI dataset from the 1.0m telescope at the U.S. Naval Observatory, Flagstaff, AZ (NOFS), and found that the new object was quite extended. After further research, I found that the object was present in the GCVS as QX Pup, a Mira. There was quite a bit of discussion about this on VSNET at the time (see the archives for vsnet-chat, 3976ff).
The story gets even more interesting. The variability was discovered by Feast, et al. (1983MNRAS.203.1207F), where they observed at 2.2microns with a single-channel photometer with 36arcsec aperture, and found variability with period 648 days and a K-band amplitude of one magnitude. Based on this infrared variability, QX Pup was added to the GCVS via the 67th name-list of variable stars (Kholopov et al, 1985IBVS.2681....1K). Cohen (1981PASP..93..288C) measured the spectral type to be M9III.
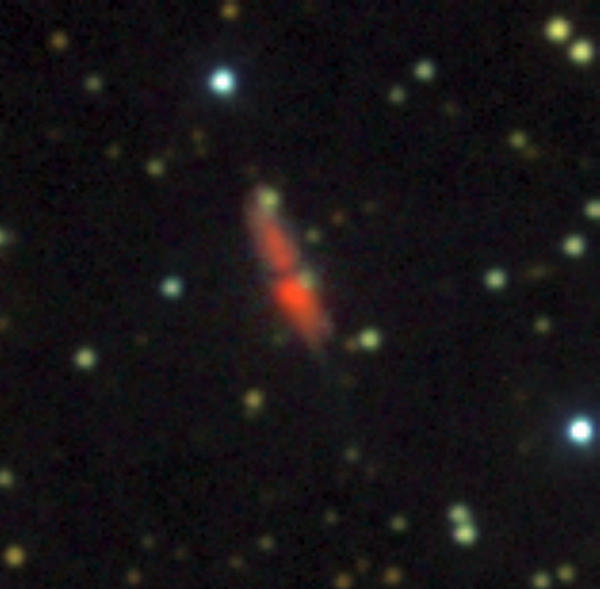
Note that this is an infrared-discovered variable star. So what did Nachshony observe? It turns out that this source has been known for quite a while as a radio source, and with multiple water vapor and SiO maser emission: OH0739-14 and OH231.8+4.2, discovered by Turner (1971ApJL...8..73F). It is also known by the popular names "Calabash Nebula" and "Rotten Egg Nebula." Optical wavelength and JHK color images of it are given below in figures 1 and 2 (from my work at NOFS). Note that, at I-band, you see the two lobes of the bipolar nebula. The southern lobe is denser and brighter, and that is what the unfiltered Israeli observations were of, with seeing making the "cloud" appear to be stellar.
 |
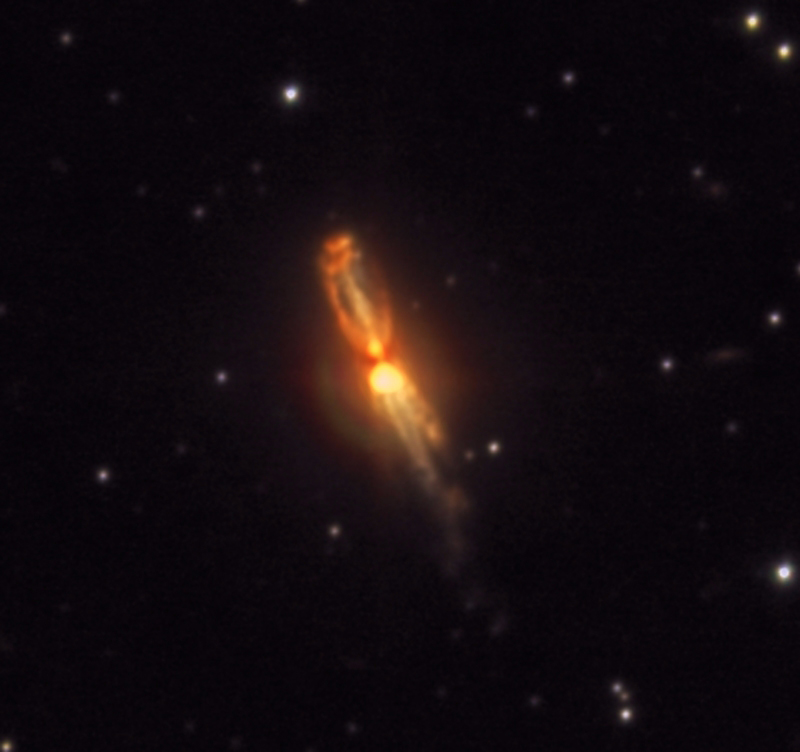 |
| (L) Figure 1: BVI band image; (R) Figure 2: JHK band image. Click each image to enlarge. Both images taken by Arne Henden while at the USNO Flagstaff Station (NOFS) | |
The bipolar nebula can also be seen in two Astronomy Picture of the Day postings: November 1, 1999 and September 3, 2001; both based on HST NICMOS images, plus some ground-based emission line images. I've included one of these HST images as figure 3 in this article.
QX Pup is quite unusual, as it shows a post-AGB star (a Mira) but with a protoplanetary nebula. What is going on? No one knows, and further, no one has really studied the embedded Mira beyond the Feast paper. It is time to revisit this field!
Project 1 - QX Pup
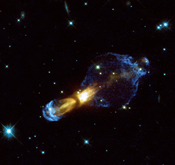 |
| Figure 3: The Rotten Egg Nebula Credit: V. Bujarrabal (OAN, Spain), WFPC2, HST, ESA, NASA |
The variable is obscured at visible wavelengths, but the reflection off of the bipolar nebula mimics the variation of the embedded source. Interestingly enough, you can actually measure the physical dimensions of the nebula if you know the phase of the Mira, as there is significant light-travel time from the illuminating source to the nebula. So you can observe the light variation of the Mira from the reflection, but you won't know the phase of the intrinsic pulsation. First things first, though - we need a good light curve of this variable. We have added a full BVRI sequence for QX Pup in VSP, so if you plot a finding chart, you can access this photometry. Right now, the source is easily visible at Ic with the 35cm Sonoita Research Observatory (SRO) telescope, with the south lobe shining at about 12th magnitude. So CCD observers should be able to follow the entire light curve at Ic, and perhaps at shorter wavelengths depending on telescope aperture and exposure times. Give it a try! My guess is that, at maximum, visual observers should also be able to detect the "light echo", but no one has tried as far as I know. Since this is a 700day 551day [see note at top of page] Mira, once per week is probably sufficient cadence, though more often is also acceptable. QX Pup is located at:
07:42:16.83 -14:42:52.1 (J2000)
Though the southern nebula will be a few arcsec from this position. Use a large enough aperture to include all of the southern nebula as if it were a star, and report it as QX Pup.
Project 2 - The open cluster M46 (NGC 2437)
Surprisingly, there is very little research that has been done on this nice open cluster. It will be obvious on your images if you center QX Pup, as a higher density of stars to the southwest. The cluster is quite large, containing about 500 stars in a tidal radius of about 13 arcmin. APOD has a nice picture from August 4, 2005 showing the cluster. More detail about M46 can be found at the SEDS site. It is located at 07:41.7 -14:49 (J2000).
However, very little photometry of the cluster has been published. The only variable-star study I could find is Lapasset, et al. (1991IBVS.3594...1L), where one variable is identified. I'm sure that it is on the "radar" for several other groups (for example, EXPLORE/OC, Von Braun et al., 2005PASP..117..141V) and so the variable-star content will be known some day, but here is your opportunity to find a few variables by yourself! This is a nice side project if you are doing CCD imaging.
Project 3 - The planetary nebula NGC 2438
One of the cool things about NGC 2437 is that a planetary nebula, NGC 2438, appears to be superimposed on the cluster. The planetary nebula is also in the same northeast quadrant as QX Pup, so you get to image both of them simultaneously! Its coordinates are: NGC 2438 07:41:51.426 -14:43:54.88 (J2000)
The SEDS site has a nice description of this object. I can't find a really nice deep exposure of this nebula, though David Malin supposedly has one that shows an extended halo beyond the apparent diameter of 66 arcsec. However, if you look at the images, you can see the faint central star. Being a white dwarf, it is possible that this star is variable. Can you image it with sufficient time resolution to detect variability? Can you separate it from the nearby contaminating star? The separation is only about 5arcsec, but the star is visible on our SRO images. Give it a try and see. Do a deep narrow-band image and see if you can see the extended shell.
Project 4 - What is your visual estimate accuracy?
 |
Click image to enlarge. V-band image from SRO, with suspected variables M46_V01 and M46_V02 marked. The crosshairs indicate the position of QX Pup. |
OK, you think you can measure to +/- 0.2mag? Or do you think you can measure better than this? Here is your chance to find out! We have posted a really nice sequence for QX Pup, so lets use that sequence to measure another star. I think this one is constant, but I'm not sure. I want each visual observer to weekly measure this star for the remainder of the season on this field. The star is located at 07:42:07.05 -14:39:38.3 (J2000) and is roughly V=12.9 with pretty standard color. Don't worry about other observers and how your measures compare with theirs; each observer will be considered on his/her own for this project. Report the star as M46_V01.
Project 5 - What is your CCD estimate accuracy?
You don't think I'd avoid a CCD project, do you? Ok, here is your chance as well. I want you to consider taking multiple images whenever you report your photometry. This is automatic with time series work, but when just making one observation per night and then moving on, take 3-5 images instead of just one. Determine the magnitude in your normal way, but report the mean and the standard deviation of your 3-5 images instead of just Poisson error of a single image. This will give you a much better estimate of your photometric error, and also gives you the ability to remove one discrepant image (satellite, airplane trail, cosmic ray, etc. affecting an important star). So take 3-5 images every time you visit this field.
Secondly, my photometry seems to indicate the following star might be variable: 07:42:18.59 -14:34:30.3 (J2000) Let's call this one M46_V02. It is about 10.3 and quite red, with (B-V) of about 1.6, which is why it is probably a real variable. I don't have enough information, and it is outside the cluster radius, so it is probably not associated. However, start observing this one so that we can tell for sure!
Project 6 - Rough determination of your tranformation coefficients
M46 is a nice cluster in that it contains lots of very blue stars. In the background, though, there is quite a bit of extinction, so we have some very red objects that may be intrinsically red, but are most likely bluer stars that have been reddened. Whatever the case, there is a wide color range of objects in this field. Take your images and hold onto them - I'll give you some instruction at a later time about how to determine your coefficients from such images. The coefficients won't be perfect, but at least it will demonstrate the process. I'll probably talk more about this about the time the field sets for the year - let's say sometime in May.
Good luck! I hope you like this little set of projects. I have a few more ideas for later in the year, once we gain experience here.
Arne