

Now that I'm able to import ASAS-SN data thanks to the revised plugin, I have a question or two. I have analyzed several data sets but the period that results from DC-DFT (using the top hit) never seems to match what ASAS-SN has calculated. Further, when I do a Phase Plot using VStar's calculated period, it is generally messy, indicating the period is incorrect.
Let me illustrate this with the data for the eclipsing binary BV Ant.
Here is the data I'm using: ASASSN-V-BV_Ant.csv
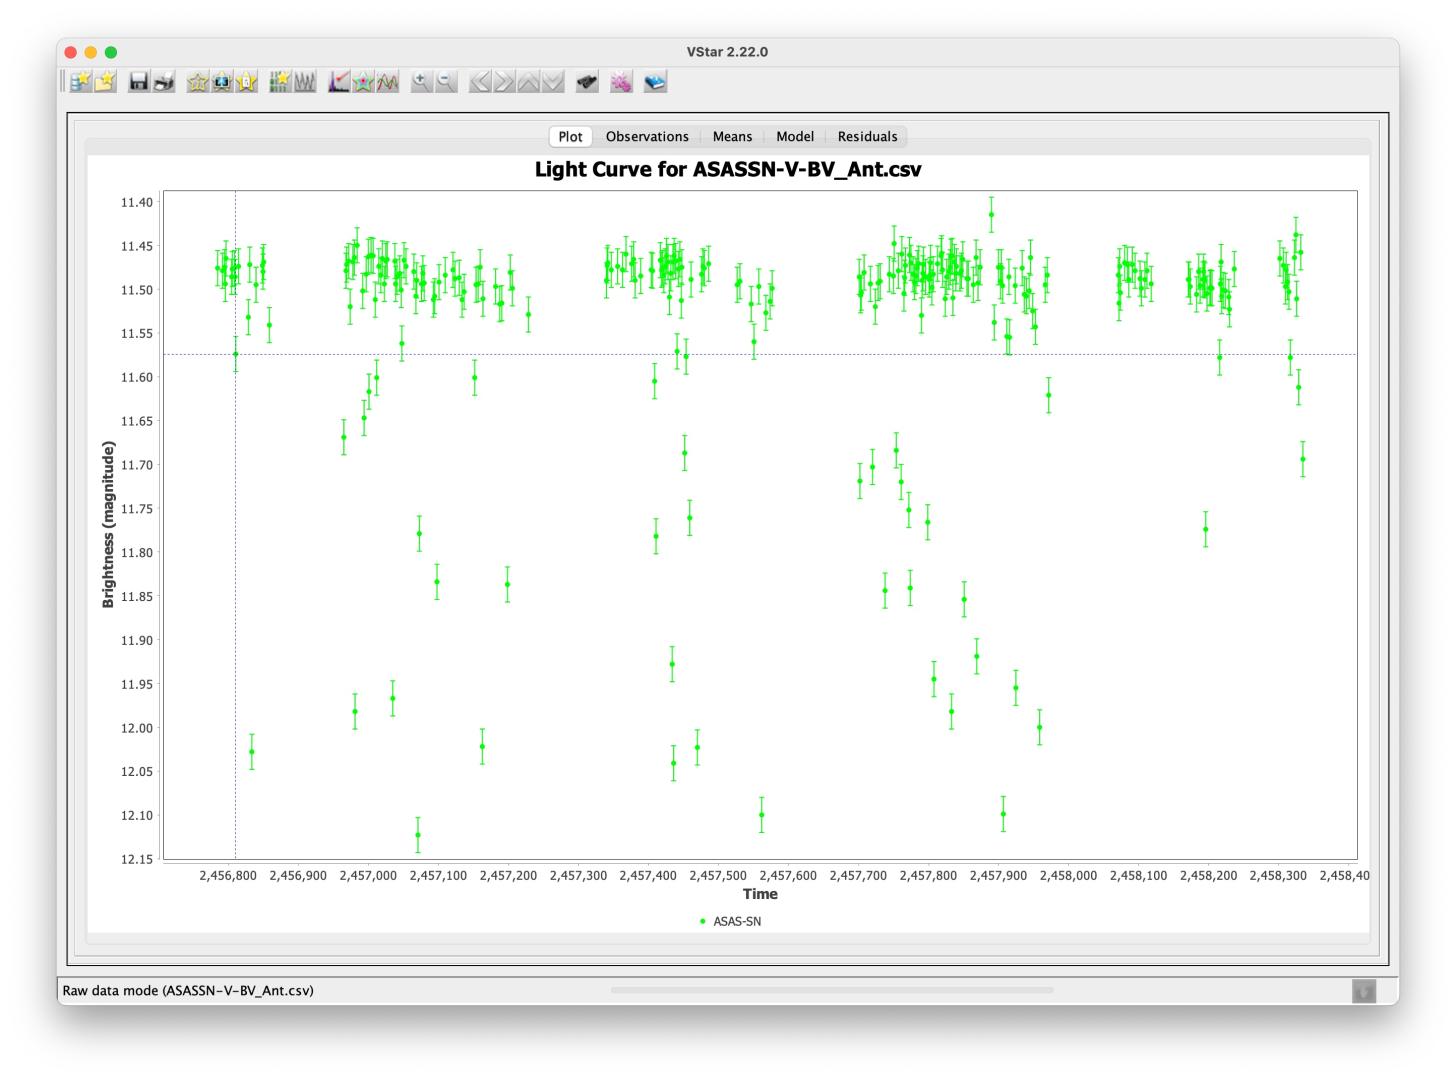
Here is a picture of the raw data as shown in VStar: BV_Ant_Raw Data.jpg
ASAS-SN calculated the period as 3.59428 days with epoch 2457435.78608
Here is the nice Phase Plot using the period and epoch give by ASAS-SN: BV_Ant_Phase_Plot_With_ASAS-SN_Period.jpg
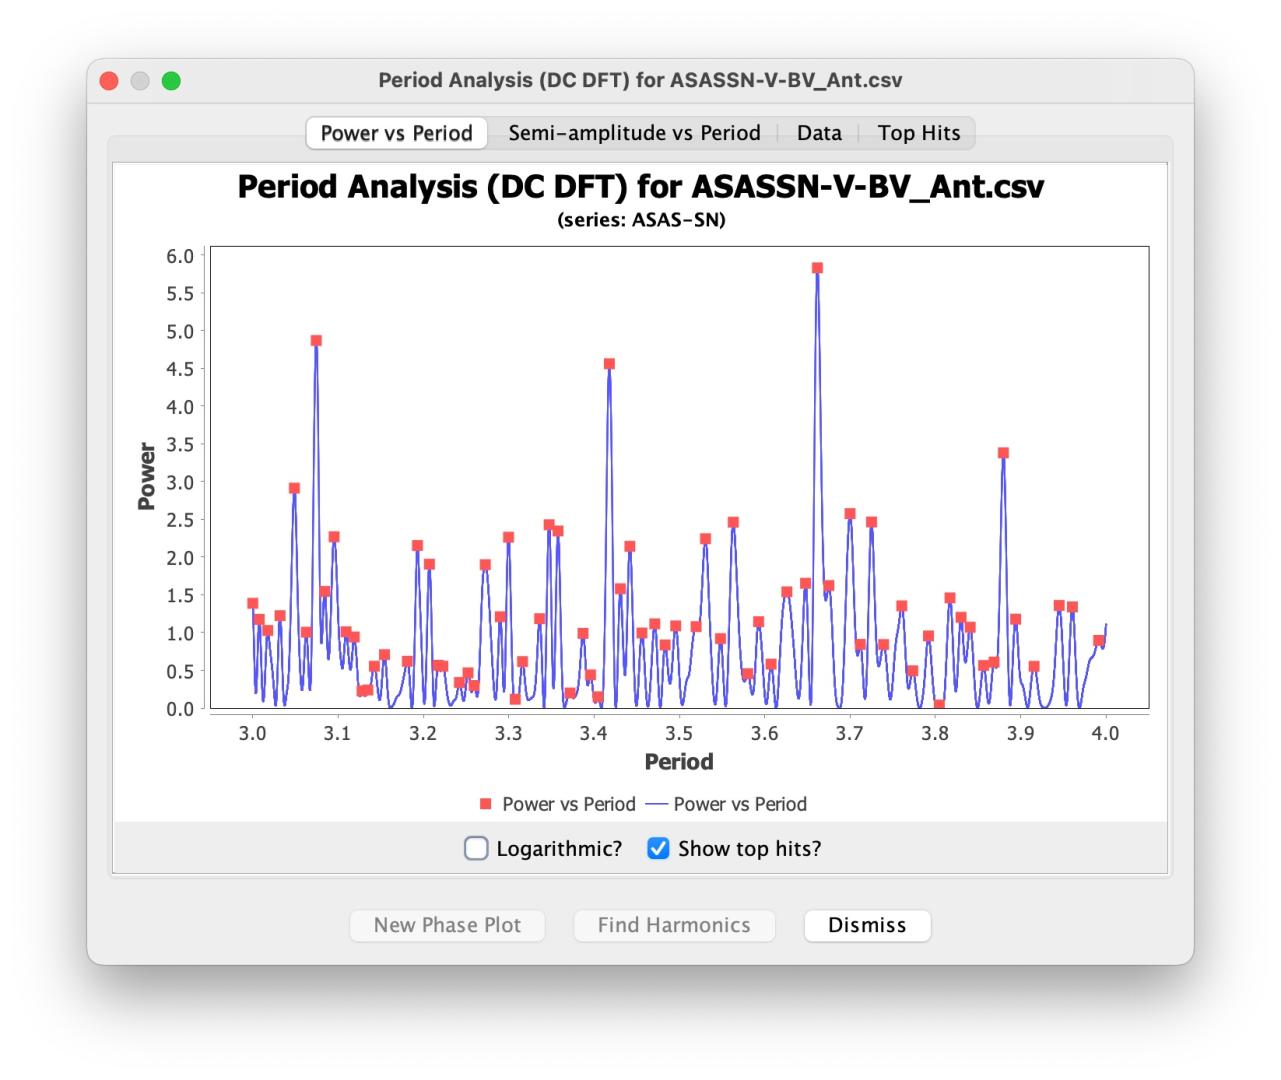
If I use VStar's DC-DFT Period Range tool with Low Period = 3; High Period = 4; Resolution = 0.00001 then I get this somewhat messy power spectrum: BV-Ant_Period_Analysis.jpg
The top hit here for the period is 3.66176, significantly different from ASAS-SN's 3.59428.
Creating a Phase Plot with this period give this messy graph: BV_Ant_Phase_Plot_With_VStar_Period.jpg
So I assume I'm doing something wrong given I can't get close to the actual period, which gives a nice phase plot. Can someone give me some pointers for how to do this? The reason I'm interested is that one of the needed VSX tasks is calculating periods for stars that don't have one listed. Obviously some stars are irregular and won't have a period, but I would think that most eclipsing binaries should have one.
As I've said, I have done this with 3 other eclipsing binaries and can't get a closely matching period on any of them.
Thanks,
Bill
It's a while since I've done this sort of thing, but once you have your first period estimate from a fairly wide low-high period range setting (in your example, 3 to 4 days for BV Ant), try narrowing the period incrementally and repeating the analysis.
Roy
Roy,
Thanks for the suggestion. I just tried slightly below the ASAS-SN value of 3.59428 up to slightly above my 3.66176. This gave a more distinct power peak but it once again was at 3.66176.
Bill
Bill,
I get the same results as you do. I've reached the limit of my knowledge on DCDFT.
AoV with period range gives a better result.
Roy
I've run the same analyses on Peranso.
DCDFT yields a period of about 3.66d. Anova yields about 3.594d.
There is an issue here I don't understand.
The data are not uniformly spaced, although generally closely spaced, so presumably it is appropriate to use DCDFT.
Roy
Hi Roy, Bill
I don't claim to have the definitive answer and I have no doubt that there are other more learned voices in the community who can contribute to this conversation.
However, I'll give my take on this and encourage others to do likewise.
It's instructive to ignore the ASAS-SN period and instead, initially set the period search range in VStar to say, 0.2 to 3.7 with a resolution of 0.001.
For DCDFT the clearly strongest top hit is 1.797.
For AoV (with 10 bins), the top hit is 3.954.
Notice that the DCDFT result when doubled is also, 3.594. You can enter 1.797*2 in New Phase Plot when selecting a top-hit.
I've seen effect this many times when carrying out period search on eclipsing binaries compared to other variable types.
So, my approach is normally to try a wide range with both methods, then to narrow down using AoV for eclipsing binaries, e.g. try a range of 3 to 4 with resolution of 0.0001 with AoV. That's gets fairly close to the answer. Then try 3.5 to 3.7 and change the resolution by a factor 10 to 0.00001. There is some experimentation required.
In case you're wondering why I chose the period search range 0.2 to 3.7, that's because many eclipsing binaries fall within that range when you look at VSX data. An exploration with Paul York some time ago helped me to see that. Happy to say more about that.
So, what's going on here?
DCDFT, and I suspect Fourier methods in general, do best when the data is sinusoidal, e.g. pulsating variables since the trial functions involve trigonometric functions (and the corresponding power determination).
AoV on the other hand involves a series of ANOVA calculations (and the corresponding F-statistics and p-values) for phased data. Think of your messy phase plot comment above.
Very different approaches to period search.
For an eclipsing binary, there are often two clear changes in brightness dips in a single cycle, that I suspect can "confuse" Fourier analysis.
I too am trying to find the time to find periods for stars in VSX.
Grant Foster's light curve analysis book looks mostly at pulsating variables but it would be great to hear his take on this. I would also like to know whether there has been much contribution to the variable star period search algorithm literature (vs more general signal analysis literature) on this subject because it seems quite important in practice.
I hope that helps.
David
David, thanks for chiming it on this.
How are you doing the ANOVA analysis? Is this in VStar? Peranso?
I find it somewhat distressing that your DCDFT analysis came up with half the period given by ASAS-SN. This is particularly true since your range includes the doubled value. How is one to know that this is not correct?
It seems that ANOVA might be the best for these eclipsing binaries. However, before I tested eclipsing binaries I also ran the test with some long period Mira-type variables. In this case DCDFT still came up with periods that were several days off from what ASAS-SN calculated. I would be curious to know what ASAS-SN is using for analysis.
I guess the moral of this story is that finding the period is somewhat akin to black magic.
I wonder if some scheme where you try different periods and see what phase plot is "least messy" would be the best. Is that what the ANOVA method is doing?
I just stumbled upon this nice tool at the NASA Exoplanet Archive: https://exoplanetarchive.ipac.caltech.edu/cgi-bin/Pgram/nph-pgram
If I upload the data file we've been using and use the Planvchan algorithm and step method, I get a period of 3.59431882 days which is quite close to ASAS-SN's 3.59428.
Here is the output showing what options I chose: Periodogram.jpg
Interestingly, if I use the Lomb-Scargle algorithm, I get a period of 3.66210937 which is quite close to VStar's 3.66176. (I have no idea what any of these algorithms are doing).
It still seems like black magic in that small changes to input parameters can significantly change the period.
Anyway, this seems like a useful tool to supplement VStar.
Hi Bill (I will soon replying your email on VSX, sorry!),
there is another thing to keep in mind here: you are not using the best example to test for EA periods since this system is eccentric and also both minima are deep, and thus there is some extra complications to the period analysis.
Usually you will have minima separated by 0.5 phase units and thus multiplying the result by two will give you the orbital period (that is not a software problem, it is how it is, if there are two similar eclipses, the period will be taken as half the orbital period).
But if you look at the phase plot of BV Ant, you will see that you have one eclipse at phase 0.00 and the other at 0.44. I am not surprised that some bogus periods will come up due to this fact.
The best period for the system is the one in VSX, 3.59426 d. There is no need to change epoch or period.
You can use the recent ASAS-SN epoch and plot the ASAS-3 light curve with that period and you will see that the phase plot shows minima at phase 0.00:
http://www.astrouw.edu.pl/cgi-asas/asas_variable/110125-3710.3,asas3,3.59426,7435.786,500,0,0
Combining datasets to have the longest possible time baseline is the best way to improve/determine periods.
Cheers,
Sebastian
The Plavchan algorithm is described briefly here:
https://coolwiki.ipac.caltech.edu/index.php/What_is_a_periodogram%3F
as:
Phase Dispersion Minimisation (going to back to phase plot messiness) seems to be a general class of period search algorithms. AoV could probably be thought of as belonging to this class, just using ANOVA F-statistic and p-values rather than minimizing the sum of the squares of the differences from one datapoint to the next.
PDM goes back at least to a 1978 paper by Stellingwerf: https://ui.adsabs.harvard.edu/abs/1978ApJ...224..953S/abstract
Note that the web page above also says of one of the other algorithms offered by the NASA exoplanet period search tool:
This can also be said of DCDFT.
In general, more period search algorithms, rather than less, seems advisable.
So far I have added two to VStar (DCDFT, ported to Java from Fortran) and AoV (implemented in terms of ANOVA and based upon AoV descriptions elsewhere, e.g. see https://academic.oup.com/mnras/article/241/2/153/1051391; "We recommend one way analysis of variance (AoV) as a method for detection of sharp periodic signals.").
The plugin architecture of VStar allows for other period search algorithms to be incorporated. I have in the past considered adding a plugin for PDM and others. My main problem is time and what parts of VStar to devote some subset of it to, largely driven by community need. I'm sure you understand that problem. Some others in the AAVSO community have taken to creating various plugins (observation source for example) and I encourage that.
David
Thanks for the link to the Planvchan method. Yes, it seems like it falls in the ANOVA class of methods as is the PDM method. They seem to be the most robust and Tonny Vanmunster, the author of Peranso, has this to say about ANOVA in general:
Nice re: ANOVA.
Hi Bill
First, thanks for SkySafari! I just read your contact page. I use the iOS app all the time. Very cool.
The ANOVA analysis is via the AoV (Analysis of Variance) period search plugin:
It essentially folds the light curve over a range of periods at a given resolution (and bin size) and computes one-way ANOVA. The results table and plots come from this.
See the Plugin Manager section of the user manual or just the plugin library link above.
Does Peranso give the same result for the DCDFT range 0.2 to 3.7 as VStar?
I would be interested to talk further with you here about particular Miras.
David
I had forgotten (or not noticed) there was an ANOVA plugin. I'll give it a try.
I went ahead and purchased a Peranso license. It has several different ANOVA methods. I will compare it to the Stars plugin.
I've come to realize I'm probably being a little OCD about what period the various routines come up with. I suspect as long as they are within a few percent of each other, it probably doesn't matter. I have notice that some methods can give larger errors than that but it is probably because I'm using the wrong method for the type of light curve. For example, the Fourier Transform methods don't do a great job on eclipsing binaries.
Peranso has a couple of tricks to ensure the periods you get are real an not the result of sampling irregularities.
I installed and tried the VStar ANOVA plugin with the BV Ant eclipsing binary star we've been discussing.
VStar: 3.594d (0.0002 resolution. Couldn't get more as then VStar would just run forever - probably the garbage collector)
Peranso: 3.59402d
ASAS-SN: 3.59428d
VSX: 3.59426d
So they are all in excellent agreement. Given how well the VStar ANOVA method works, I might recommend that it come standard in VStar. Many folks (like myself) might not realize it is available.
Bill
Making AoV an intrinsic plugin is something I've considered too.
I've captured this in https://github.com/AAVSO/VStar/issues/336
David
What period range was used here for BV Ant?
A wide range with resolution 0.01 or so then higher resolution (such as 0.0002) with narrower period range is best from a speed viewpoint.
AoV hasn't had much profiling attention paid to it so it would be interesting to discover the cause of the inefficiency here. Given the way it's coded, I don't know whether GC would be a big contributor. Also, other than top-hit collation, trial period testing is embarrassingly parallel, so a TODO list item is to make use of multiple cores for AoV (so too for DCDFT) and there are comments re: approaches in the source code. Other issues may need addressing first, and I wouldn't want to violate Knuth's maxim too soon. :)
David
I realized I didn't answer your DCDFT question.
The Peronso DCDFT has (Ferraz-Mello) after its label, so I don't know if this is a modification of the basic DCDFT or not. However, when I run it against the BV Ant data I get 0.718796d for the period and VStar's was 1.797. So they are not the same and surprisingly the value is not close to 1/2 the actual period like VStar's. I don't know how to interpret this.
Regarding your question about Miras, I'll run a few through both and post how they compare. Probably not really a useful exercise, but I'm having fun playing with this.
Here are some comparisons of Mira periods calculated different ways. The stars were sort of chosen at random from Miras in the LPV target list. For the 3 stars I show the periods from VSX, ASAS-SN and the DCDFT and ANOVA calculations from Peranso and VStar. You can see small differences of a couple of days, but it is probably not much of a big deal.
Make of it what you will...
RS Aqr (15 - 9.3)
============================
VSX: 217 d
ASAS-SN: 218.8128426 d
Peranso: (DCDFT) 2.13.356091 d; (ANOVA) 213.561132 d
VStar: (DCDFT) 213.386 d; (ANOVA) 213.78 d
T CMi (15.1 - 9.5)
============================
VSX 325.8 d
ASAS-SN: 332.3546781 d
Peranso: (DCDFT) 324.306794 d; (ANOVA) 326.370757 d
VStar: (DCDFT) 324.33 d; (ANOVA) 327.0
W Dra (13.5 - 7.2)
============================
VSX 278.6 d
ASAS-SN: 278.6 d
Peranso: (DCDFT) 292.185076; (ANOVA) 292.312189
VStar: (DCDFT) 292.209 d; (ANOVA) 290.77 d
Hi Bill
That 0.718796d result is interesting. I guess it would be worth asking the Peranso developer about that. I don't know how to interpret it either.
David
Bill
Re: your comment above, I meant to add that Ferraz-Mello is just a reference to the 1981 paper describing DCDFT:
https://adsabs.harvard.edu/full/1981AJ.....86..619F
I refer to that here:
https://app.dev-mintaka.aavso.org/media/jaavso/2881.pdf
as does this page I note:
https://www.cbabelgium.com/peranso/UserGuideHTML/DCDFTFerraz-Mello.html
David
I suspect the reason that you get such a different period for DCDFT in VStar compared to the period given by ASASSN is that you used the period range option rather than frequency range. It is always better to use a frequency grid rather than a period grid when doing DCDFT analysis. DCDFT is based on coefficient fitting of sinusoidal functions, Asin(2πf) + Bcos(2πf), whose arguments are linear in frequency. Therefore, DCDFT based on frequency is evenly spaced with respect to the argument of the functions, but a search based on Period is not.
I did DCDFT analysis in VStar using the frequency range option with low f =0.2 (P = 5d) and high f = 5 (P = 0.2d) and resolution 0.0001. The highest power signal was at f=0.5564 equating to a period of 1.797268. Twice that period is 3.594536d compared to the ASASSN period of 3.59428d and the VStar AoV analysis period of 3.5942. If you do the VStar AoV analysis with a period range of 1d to 4d you can see the second highest power period (outside the wings of the highest peak) is 1.797 days. That is half the orbital period and a match to the period given by DCDFT.
I ran DCDFT again with a frequency range of 0.5 to 0.6 and resolution 0.000001 which gave the highest power signal at f = 0.556418 equating to a period of 1.79721. Twice that period is 3.59442d. which is even closer to the period given by ASASSN.
Since DCDFT assumes that the signal is comprised of an algebraic sum of sine and cosine functions of various frequencies and their harmonics, this light curve and many binary light curves are not well represented by DCDFT because they have long relatively constant segments separated by sudden V shaped valleys. Therefore, the DCDFT solution will include a lot of frequencies to approximate the shape of the light curve. However, most of these frequencies do not represent physical processes taking place. They are just part the mathematical model needed to approximate the shape of the light curve using sinusoids. Because the primary and secondary mimima are so similar, DCDFT doesn’t distinguish between them and gives the highest power result at 2x the real orbital frequency corresponding to half the orbital period. You can see the "forest" of DCDFT power peaks if you repeat the DCDFT analysis outlined above.
AoV assigns a higher power to the correct period. If you do a phase plot at 1.797d it becomes obvious why this occurs. Although the period between sequential primary minima is the same as the between sequential secondary minima and both equal the orbital period, the period of adjacent primary and secondary minima is not half the orbital period. Therefore, the light curve folded at half the orbital period is “messier” with closely spaced double valleys “bridged” across their tops by lines of relatively constant observations. The pairs of valleys are still separated by long segments of relatively constant observations. Clearly the light curve is not folded in agreement with the orbit. Since AoV is the ratio of variance of bin means from the global mean divided by the combined variances of data within bins from their bin means (F statistic, which is the power), folding at half the period results in a lower ratio (power) than when the light curves are folded using the correct orbital period.
Ferraz-Mello authored the seminal paper on the use of DCDFT. VStar uses Ferraz Mello DCDFT. Therefore, I have no idea why Peranso gives such a different period. I can only assume there are differences between the two sets of code.
Brad Walter
Brad,
You wrote:
“Ferraz-Mello authored the seminal paper on the use of DCDFT. VStar uses Ferraz Mello DCDFT. Therefore, I have no idea why Peranso gives such a different period. I can only assume there are differences between the two sets of code.”
I ran DCDFT and ANOVA on BV Ant in both Peranso and VStar, specifying period, not frequency. In both sets of software, DCDFT gave a period of about 3.66d and ANOVA a period of about 3.594d.
Roy
Roy,
That is good news. They should give the same answer with equivalent settings. I don't know why Bill calculated 0.718796d with Peranso. Can you try a DCDFT by frequency range in Peranso to see what result that gives? If you use the same settings I used I would expect it to give the same results as my analysis. Excuse my ignorance regarding Peranso's capabilities.
Brad, WBY
I just tried the DCDFT again in Peranso. Once again it gave me a 1.797010 d period. To be clear, my settings are:
Range Start: 1
Range End: 5
Steps: 5000
The Lomb-Scargle gave me the same value. I even tried changing the units to Frequency rather than time and it gave me a frequency of 0.55648 c/d which, taking the inverse, gives me 1.79701d. So the result is robust. The ANOVA algorithm gives me the correct value of 3.594020 (which is twice the DCDFT value)
Interestingly, if I narrow down the search range to [2, 4], it gives me 2.254029 d, so still not the correct value. I don't know if it is worth pursuing with the Peranso developer.
If I do the DCDFT in VStar with the same range and resolution ([1, 5] and 0.0002) then it also gives me a top hit of 1.7972.
Roy had said:
I don't understand what Roy is doing differently from my to get a different outcome from DCDFT. Roy, what are the exact DCDFT search parameter you are using? My guess is that we are using slightly different params.
Thanks for this insight Brad. Yes, this is something I should have thought to mention as well, but you expressed this in a way I was unlikely to have.
The part of what you said:
makes sense but is the sort of thing that would probably benefit from a suitable diagram / annotated LC/PP, e.g. to illustrate this:
David
David,
This is probably a silly question, but does AoV bin the data after the trial folds. In other words does 10 bins correspond to 0.1 phase segments for each trial period?
Brad Walter
Hi Brad
It's not a silly question, just a reasonable question about the implementation. Nothing much is obvious.
Yes, AoV bins the data after each trial fold and yes, for the default 10 bins, this corresponds to 0.1 phase segments for each trial period.
To be more specific, the bins are used in the ANOVA computation for each trial period.
David
Having just read through this thread again, I would like to make a number of comments:
1. As one spending a fair amount of my time calculating periods for eclipsing binaries which have no period in VSX, this discussion is very timely. I have run up against similar problems using VStar and other tools.
2. As Bill suggested, it is probably worth bearing in mind that searching for a period will always be someting of a "black art", no matter how good the algorithms and/or software become. I say this because, IMHO, the "acid test" of whether you have the "correct" period is to eyeball the phase plot (folded light curve) based on a candidate period. If this plot is "nice and tight" (whatever that might mean) then the period is a "good one". Having done that, the only way to decide that you have the best period (as opposed to just a "good" period) is to produce another phase plot based on a new candidate period and see if the resultant curve is "nicer and tighter" than the previous one. This is obviously a matter of human judgment and is not strictly repeatable. In other words, other viewers of the light curves may not choose the same period, especially when we are getting to six decimal places.
3. Anyway, the discussion in (2) leads me to suggest that the Plavchan algorithm might prove to be the algorithm of choice for eclipsing binaries. As David defined it, "...a binless phase-dispersion minimization algorithm that identifies periods with coherent phased light curves (i.e., least “dispersed”)". This seems to mirror "the trial and error approach with eyeballing" described above. Note that I am not suggesting here that VStar be modified to include Plavchan at this stage ...
4. Grant Foster in his book, "Analyzing Light Curves - A Practical Guide" discusses the AOV Periodogram (pp. 136-143) and he concludes that , where eclipsing binaries are concerned, AOV is a better method than DCDFT. He says "A real advantage of AOV for period search is that it's more sensitive than the DCDFT (or Fourier methods in general) when the signal shape is profoundly non-sinusoidal ... [as, for example] with eclipsing binary stars ... Fourier methods are far less sensitive to detecting such shapes". He also says "it is often useful to increase the number of bins in the AOV periodogram". Ever since reading that, I have used the "AOV with Period Range" tool in VStar.
5. I think this discussion indicates that there is a gap in the training course offerings, as currently provided by the AAVSO: The VSX team are simply too busy to stop and teach would-be analysts how to go about finding periods. The CHOICE course "How to Use VStar" does not cover the detailed practical steps for finding a period in a set of time-series data; as I recollect, it is focused more on how to use the VStar tool and its features. On the other hand, the course "Analyzing Data with VStar", run by Brad Walter in the past, might be expected to do so? However, it has not been offered for a while - since maybe 2020? Brad, is there any prospect that you might offer this course again?
6. An alternative to a full-blown course might be a "How To" session, using Zoom, in which various cases (perhaps limited to eclipsing binaries) were worked through (using screen sharing), with maybe the cases supplied beforehand by the interested attendees? It would be important to use VStar as the primary tool, only going to alternate tools if VStar happens to prove inadequate in a particular case.
Paul
Hi Paul
Re: 2. yes, I completely understand. Seeing is "believing". One thing that can help is looking at the various measures of error after a model fit from a DCDFT or using the Current Mode ANOVA plugin to visualise what AoV is doing at a particular trial period/phase plot.
Re: 3. Plavchan could be "just another" period search plugin, as AoV currently is.
Re: 4. quite right! Thanks for the reminder about this. Eclipsing binaries are mentioned 4 times in Foster. I guess I was trying to say what Grant said in one of my comments, but did not articulate it as well. His comment about increasing the number of bins is worth considering carefully as well!
Re: 5. and 6. yes, even beyond the two VStar courses, perhaps a course geared towards VSX submissions would be worth considering!
David
"I don't…
Bill wrote:
"I don't understand what Roy is doing differently from my to get a different outcome from DCDFT. Roy, what are the exact DCDFT search parameter you are using? My guess is that we are using slightly different params."
Bill, sorry about this delayed reply. Very busy the past 24 hours. Originally, I tried analysing the period (not frequency) over the range 3 to 4 days. I think the resolution was about 1000 (0.001), but maybe even 10,000 (0.0001). These ànalyses produced the results I first mentioned.
I tried again earlier today with a wider range (0.2 to 6 days, I think) of periods, a resolution of 1000 (0.001) and got quite different results, although DCDFT did not run properly on VStar. I don't know why. I'm away from home and don't have my computer tonight so can't send you these new results now. But the results that seemed valid were the same on VStar (AoV) and both DCDFT and ANOVA on Peranso. The period displayed was one half the VSX period, 1.797 I think.
Roy